The sixth edition of a bestseller, Air Quality provides students with a comprehensive overview of air quality, the science that continues to provide a better understanding of atmospheric chemistry and its effects on public health and the environment, and the regulatory and technological management practices employed in achieving air quality goals. Maintaining the practical approach that has made previous editions popular, the chapters have been reorganized, new material has been added, less relevant material has been deleted, and new images have been added, particularly those from Earth satellites.
New in the Sixth Edition
New graphics, images, and an appended list of unit conversions
New problems and questions
Presents all-new information on the state of air quality monitoring
Provides the latest updates on air quality legislation in the United States
Updates the effects of air pollution and CO2 on climate change
Examines the effects of the latest changes in energy production and the related emissions and pollutants
Offers broadened coverage of air pollutant emissions and air quality in a global context
This new edition elucidates the challenges we face in our efforts to protect and enhance the quality of the nation's air. It also highlights the growing global awareness of air quality issues, climate change, and public health concerns in the developing world. The breadth of coverage, review questions at the end of each chapter, extensive glossary, and list of readings place the tools for understanding into your students' hands.
Häufig gestellte Fragen
Wie kann ich mein Abo kündigen?
Gehe einfach zum Kontobereich in den Einstellungen und klicke auf „Abo kündigen“ – ganz einfach. Nachdem du gekündigt hast, bleibt deine Mitgliedschaft für den verbleibenden Abozeitraum, den du bereits bezahlt hast, aktiv. Mehr Informationen hier.
(Wie) Kann ich Bücher herunterladen?
Derzeit stehen all unsere auf Mobilgeräte reagierenden ePub-Bücher zum Download über die App zur Verfügung. Die meisten unserer PDFs stehen ebenfalls zum Download bereit; wir arbeiten daran, auch die übrigen PDFs zum Download anzubieten, bei denen dies aktuell noch nicht möglich ist. Weitere Informationen hier.
Welcher Unterschied besteht bei den Preisen zwischen den Aboplänen?
Mit beiden Aboplänen erhältst du vollen Zugang zur Bibliothek und allen Funktionen von Perlego. Die einzigen Unterschiede bestehen im Preis und dem Abozeitraum: Mit dem Jahresabo sparst du auf 12 Monate gerechnet im Vergleich zum Monatsabo rund 30 %.
Was ist Perlego?
Wir sind ein Online-Abodienst für Lehrbücher, bei dem du für weniger als den Preis eines einzelnen Buches pro Monat Zugang zu einer ganzen Online-Bibliothek erhältst. Mit über 1 Million Büchern zu über 1.000 verschiedenen Themen haben wir bestimmt alles, was du brauchst! Weitere Informationen hier.
Unterstützt Perlego Text-zu-Sprache?
Achte auf das Symbol zum Vorlesen in deinem nächsten Buch, um zu sehen, ob du es dir auch anhören kannst. Bei diesem Tool wird dir Text laut vorgelesen, wobei der Text beim Vorlesen auch grafisch hervorgehoben wird. Du kannst das Vorlesen jederzeit anhalten, beschleunigen und verlangsamen. Weitere Informationen hier.
Ist Air Quality als Online-PDF/ePub verfügbar?
Ja, du hast Zugang zu Air Quality von Wayne T. Davis, Joshua S. Fu, Thad Godish im PDF- und/oder ePub-Format sowie zu anderen beliebten Büchern aus Biological Sciences & Environmental Conservation & Protection. Aus unserem Katalog stehen dir über 1 Million Bücher zur Verfügung.
The Earth’s atmosphere is a mixture of gases and particulate-phase substances. The most abundant of these, nitrogen (N2) and oxygen (O2), comprise ~78% and 21%, respectively, of atmospheric mass and volume. A number of trace gases make up the remaining 1%. Average concentrations (with the exception of stratospheric ozone; O3) are reported in Table 1.1. These include gases present in essentially constant concentrations: N2, O2, argon (Ar), neon (Ne), helium (He), krypton (Kr), hydrogen (H2), and xenon (Xe). Others vary temporally and spatially. These include water vapor (H2O), carbon dioxide (CO2), carbon monoxide (CO), methane (CH4), O3, the nitrogen oxides (nitrous oxide [N2O], nitric oxide [NO], and nitrogen dioxide [NO2]), ammonia (NH3), formaldehyde (HCHO), sulfur dioxide (SO2), a number of reduced sulfur compounds (dimethyl sulfide [[CH3]2S], carbon disulfide [CS2], carbonyl sulfide [COS], and hydrogen sulfide [H2S]), and odd hydrogen species (hydroxyl radical [OH], hydroperoxyl radical [HO2], and hydrogen peroxide [H2O2]). In addition to these gas-phase substances, the atmosphere contains trace quantities of particulate nitrate , ammonium , and sulfate .
TABLE 1.1 Atmospheric Gases
Chemical Species
Symbol
Concentration (%, ppmv, ppbv, pptv)
Nitrogen
N2
78.084%
Oxygen
O2
20.948
Argon
Ar
0.934
Water vapor
H2O
0.1–30,000 ppmv
Carbon dioxide
CO2
~412
Neon
Ne
18.18
Ozone (stratosphere)
O3
0.5–10
Helium
He
5.24
Methane
CH4
~1.87
Krypton
Kr
1.14
Hydrogen
H2
0.50
Xenon
Xe
0.09
Nitrous oxide
N2O
~0.33
Carbon monoxide
CO
110 ppbv (50–200)
Ozone
O3
20
Ammonia
NH3
4
Formaldehyde
HCOH
0.1–1
Sulfur dioxide
SO2
~1
Nitrogen dioxide
NO2
~1
Carbonyl sulfide
COS
500 pptv
Carbon disulfide
CS2
1–300
Dimethyl sulfide
(CH3)2S
10–100
Hydrogen sulfide
H2S
~50
Nitric oxide
NO
~50
Hydroxyl radical
OH
0.1–10
Although N2 is the most abundant constituent of the atmosphere, it has a relatively limited direct role in atmospheric and life processes. It serves as a precursor molecule for the formation of , from which plant processes synthesize amino acids, proteins, chlorophyll, and nucleic acids (organic molecules that are directly or indirectly essential to all living things). The conversion of N2 to occurs as a result of atmospheric and symbiotic biological processes.
Nitrogen reacts with O2 to produce nitrogen oxides (NOx), which include N2O, NO, NO2, gas-phase nitric acid (HNO3), and short-lived substances such as dinitrogen pentoxide (N2O5) and nitrate radical (NO3). Concentrations of these compounds or substances, unlike their precursors (N2 and O2), vary significantly in time and space. Nitrous oxide (N2O), a relatively inert gas commonly referred to as “laughing gas,” was, until several decades ago, thought to be present in the atmosphere at constant levels. It is one of a number of substances whose concentrations are increasing as a result of human activities.
The evolution of free atmospheric O2 at elevated concentrations set the stage for the evolution of oxidative metabolism, the series of energy-transferring chemical reactions that sustain most life-forms. Oxygen, as a consequence, is vital to almost all living things. It is a precursor for the production of O3 and the development of the O3 layer, the stratospheric region that absorbs high-energy ultraviolet (UV) light radiation streaming into the Earth’s atmosphere from the sun. By absorbing most of the UV radiation incident on the Earth and its atmosphere, the O3 layer shields most organic materials and living things from UV’s destructive energy.
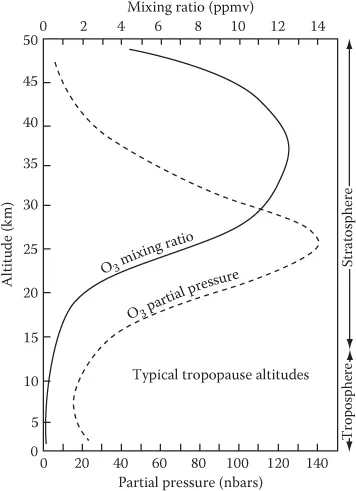
On average, background O3 levels in the troposphere are ~20 parts per billion by volume (ppbv). Ozone concentrations vary, and there is evidence that average levels are increasing as a result of human activities. At heights of 10–50 km (6.2–31 mi.), O3 concentrations increase dramatically, with peak mixing ratio (parts per million by volume [ppmv]) concentrations (defined in Chapter 7) observed at 35 km (21.7 mi.; Figure 1.1) and concentrations based on partial pressure or molecular density peak at 25 km (15.5 mi.). At ~15 km (9.3 mi.), O3 concentrations are ~0.1 to 0.5 ppmv; at 20 km (12.4 mi.), 3 ppmv; at 35 km, 8–10 ppmv; and at 50 km, 2 ppmv.
FIGURE 1.1 Atmospheric O3 concentrations expressed as mixing ratios (ppmv) and partial pressure (nbars) as a function of height. (From National Research Council, Rethinking the Ozone Problem in Urban and Regional Air Pollution, National Academy Press, Washington, DC, 1991. With permission.)
In addition to these altitude-based differences, stratospheric O3 concentrations vary from day to day, from one season to another, and latitudinally. There are also significant variations that result from quasi-biennial oscillations (air movement in the stratosphere), the 11-year sunspot cycle, and volcanic eruptions.
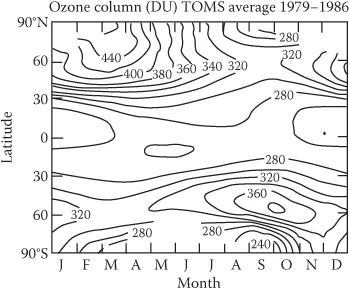
Ozone concentrations are also measured and reported as total column O3 (vertical sum, reported as Dobson units). Mean monthly column O3 concentrations are illustrated as a function of latitude and time of year in Figure 1.2. Column O3 concentrations are highest at latitudes where O3 production is relatively low. The highest O3 values are found at high latitudes in winter and early spring; the lowest values are found in the tropics. Most O3 production occurs near the equator where high levels of solar radiation are received; the observed stratospheric O3 distribution reflects a strong poleward transport during winter.
FIGURE 1.2 Total column O3 (Dobson units) averaged over the period 1979–1986 reflecting latitudinal and seasonal differences. (From WMO, Report of the International Ozone Trends Panel: 1988, World Meteorological Organization, Geneva, 1990.)
In contrast to N2 and O2, the atmospheric concentration of CO2 is relatively low, ~0.041% or 412 ppmv. Carbon dioxide is enormously important. It is one of the two principal raw materials from which green plants (during photosynthesis) make food molecules on which most living things depend. Life is carbon based, and CO2 is the source of that carbon. Carbon dioxide is also a major greenhouse gas and, because of its thermal absorptivity, is responsible in good measure for maintaining a favorable global heat balance. However, carbon dioxide is also increasing at a rate of ~2.5 ppmv/year and is also a major contributor to global warming. Other greenhouse gases are often referred to with respect to their global warming potential (GWP) when compared to CO2 which, by definition, has a value of 1.0. The GWP is the ratio of a specific gas’s ability to trap heat when com...