![]()
Chapter 1
Basic Principles of Experimentation
1.1 INTRODUCTION
The principles of experimentation can be studied by students who enjoy pure mathematics, and by those who wish to use mathematical principles as tools only for the design and analysis of their experiments. When carrying out research work at an experimental station or university, the applied biologist may be able to discuss the layout and analysis of experimental work with a professional statistician. However, when working in isolated rural areas (especially in developing countries), the experimenter must demonstrate a basic understanding of statistics and also have the confidence to solve design and data-handling problems. Even when professional support is available, it is still essential that the researcher is aware of the wide range of statistical procedures used by applied biologists. More importantly, he or she must have acquired sufficient statistical skills to interpret and discuss experimental results which are analysed using computer packages such as Genstat, Minitab and SAS.
Experimental objectives must be clearly and concisely stated at the outset of an investigational programme. Before starting a field or greenhouse experiment, it is wise to purchase a diary. The first page should be used to give a clear exposition of research objectives. The diary should contain a summary of previous cropping, a description of the treatments, detailed site plans and daily observations. When an experiment is written up, these observations may help to explain results that may at first seem to be anomalous.
1.2 FIELD AND GLASSHOUSE EXPERIMENTS
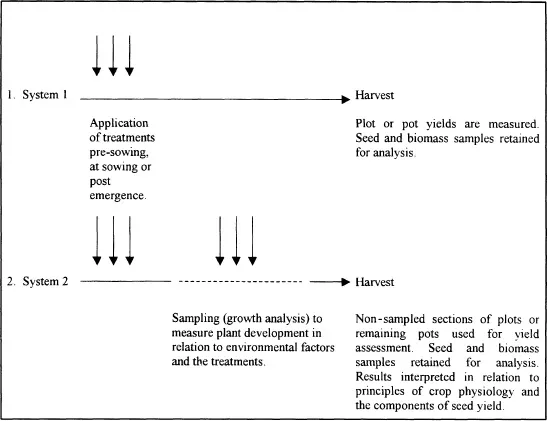
There are two main systems of experimentation used to explore the effect(s) of experimental treatments on plant development and yield (Figure 1.1). In both, treatments may be applied before, at, as well as after sowing. For example, the objectives of an experiment may be to compare different seed dressings, fertiliser placement at drilling, or the post-emergence application of a plant growth regulator at defined growth stages. The first descriptive system shown in Figure 1.1 is widely used by agronomists at arable research centres and farm demonstration sites. However, if the chosen treatments result in a significant increase in yield, the agronomist may be unable to fully explain the field results. It is impossible to provide an in-depth discussion of morphological and physiological factors affected by the treatments unless some additional measurements such as light interception, leaf area index, or crop growth rate are taken during the growing season (System 2).
Figure 1.1. Systems of experimentation
System 1 is also rather risky because the results of a season’s technical work (site mapping, cultivations, sowing, pot and plot maintenance), are solely dependent on data collected at final harvest. It is frustrating when treatment effects which were clearly visible during mid-season are obscured by lodging and seed loss due to thunderstorm damage during the ripening period. Similar end-of-season losses can also occur in glasshouse trials using System 1. In a hydroponic study on the response of wheat to varying concentrations of sulphur, the ears were destroyed by field mice which invaded the glasshouse cubicle just two days before the planned final harvest date. A trial which needed a great deal of maintenance time in relation to monitoring and topping up the different nutrient solutions only provided advice on rodent control! If measurements such as number of tillers per plant and sulphur concentrations in leaves and stems had been taken during vegetative development (System 2), some useful discussions of the effects of sulphur depletion on wheat development may have resulted.
The second system provides useful background information which may be used to interpret and discuss the final results. For example, when regular descriptive samples are taken the effects of treatments on plant morphology and the reproductive components of yield can be determined. If more sophisticated facilities are available, it may also be helpful to carry out physiological measurements such as chlorophyll concentration, light interception and photosynthesis. Subsequently, yield data can be analysed and interpreted in much more detail; additional confidence may then result in the reliability of a new product or variety. If final yield data are lost from System 2, the researcher may still have sufficient information in his or her diary to create a scientific report on vegetative development, flowering, and the early stages of reproductive development. Data collected during the experimental growing season may also be used to look for possible relationships between measurements such as soil temperature, rainfall, emergence and plant development using simple correlation techniques (Chapter 7).
As a disadvantage, the introduction of crop sampling increases experimental costs. Growth analysis is especially tedious and time consuming, and it is essential to ponder original experimental objectives before investing time in measuring components such as leaf area and numbers of seeds in pods or spikelets. The applied plant scientist may enjoy philately as a hobby, but must avoid the temptation to file vast quantities of descriptive data unless the scientific reasons are clearly defined. Computer packages will analyse data and produce means and standard errors. However, they are unable to guide the researcher on interpretative skills and sampling procedures or indicate whether the time invested in measuring a particular parameter is really worthwhile.
1.3 CHOICE OF SITE
The choice of field and the siting of a trial are probably the most important decisions made by the researcher. Incorrect choice of site may mean that the experimental results are difficult to interpret or are even meaningless. There are several common-sense starting points. It is essential to choose a uniform site as trials are designed to detect differences between small plot areas. Thus any variations in soil texture or pH within a site may partly or completely mask treatment effects. Local knowledge is clearly important, and it may be wise to consult historical records of drainage systems and former field boundaries. Previous site management must be researched because many legume and oilseed crops should be sown only once in a 5-year rotation — the principles of crop rotation must be adhered to when the experimental objectives are being defined.
An accessible site makes for ease of sampling, although it is worth remembering that trials situated near parking areas and footpaths may be subjected to damage by trespassers. It is best to avoid compacted headlands and wooded areas as downdraughts from trees can cause severe lodging. In order to minimise edge effects it is usually advisable to surround the experimental site with the crop species being studied. Frequently, plots will be positioned so that they can be sprayed with protective agrochemicals using the tramlines of a surrounding commercial crop.
When undertaking an agronomic research programme, it is valuable to have growth room and glasshouse facilities in addition to field sites. This enables detailed physiological work to be continued during the winter months. In theory, research glasshouses should provide a reasonably uniform environment in which light intensity, temperature and daylength can be controlled by computer technology. In practice, the glasshouse can be a more variable environment to work in than the field. There are frequently wide and sudden fluctuations in temperature between overcast and sunny periods even in the winter months, and variation in light profiles especially when neighbouring research cubicles are using a different daylength regime. In order to minimise these problems, it is important to re-randomise the position of the growing containers on the greenhouse benches from time to time, and surround the experimental unit with guard pots to reduce edge effects. It is essential to monitor pests and diseases — mildew, botrytis, aphids and white fly are common problems in the glasshouse, and while biological systems for insect control can be used, it is wise to have insurance supplies of agrochemicals in store, especially for the control of fungal diseases.
1.4 SOIL TESTING
Large experimental sites are more likely to include variations in soil texture, thus for most arable crop investigations the total experimental area rarely exceeds 1 ha. Larger plots are usually necessary in grassland or grazing studies in order to accommodate fencing, gangways, weighing pens and sufficient replication of the livestock assigned to individual grazing treatments.
Regardless of size it is essential to provide soil analyses before the treatments are applied. The purpose is to assess the adequacy, surplus or deficiency of available nutrients for crop growth. A standard soil analysis package measures soil pH and estimates available concentrations of phosphorus, potassium and magnesium. Some minor elements such as boron and copper can also be measured using soil samples, while others, for example manganese, are usually assessed from plant samples. For nutrient and pH assessment, soil is usually removed from the top 10–20 cm. Although it may be valuable to study nutrient levels in deeper profiles, it is often backbreaking work if traditional soil augers are used. Mechanical soil sampling equipment is available, but this is more expensive than hand-operated augers and rarely available at Experimental Stations in developing countries.
The number of soil samples must be sufficiently large to be representative of the experimental site. Within each site samples should be taken across a W pattern; 6–10 separate samples being taken along each arm of the W. Samples are usually bulked into one bag. The bulked sample comprises around 1 kg of soil which is taken to represent an entire site containing approximately 2000 t soil/ha to a ploughing depth of 20 cm. Clearly, using a small bulked sample is not a precise measure of nutrient or acidity levels and the problem of accuracy is increased by the use of very small soil subsamples for nutrient analysis. Although the researcher may have invested a great deal of time and physical effort in order to obtain a representative soil sample, the amount of soil used by the analytical chemist is often tiny. For example, when determining ammonium nitrate and nitrite nitrogen levels from fresh soil, a subsample of 20 g soil is used. For potassium, magnesium, sodium and manganese only 5 g of dried soil is required when using ammonium acetate extraction techniques. As a result it is important to assess the number of subsamples in relation to the variation between replicates analyses. If the level of variation between three or four replicates is high additional subsamples must be analysed, although for some analyses such as sulphate-sulphur this decision will be expensive. Unfortunately, all soil laboratory procedures are time consuming and costly, but this must not deter the researcher from clearly defining the pH, soil texture and nutrient status of the experimental site prior to drilling.
1.5 SATELLITE MAPPING
The careful control of inputs or precision farming is not new, and many farmers have selectively applied some agrochemicals for many years using their local knowledge of individual fields. For example, patch spraying with graminicides or the application of lime to sections of fields or headlands can often be cost effective.
New technology has been developed which may supersede conventional soil-sampling procedures for assessing the causes of yield variations that occur within most large arable fields. It is based on satellite-controlled navigation systems or GPS (Global Positioning Satellites). GP yield monitoring systems can be fitted to combine harvesters, with up to 500 grain weight checks/ha during harvest. The computer system can create a colour-coded yield map of each field. This shows yield variations across large areas, which would have been difficult to detect from auger samples. It has resulted in the development of management systems for the precise application of nutrients, and as a result manufacturers have now launched computer-controlled fertiliser spreaders.
The success of satellite precision farming systems will ultimately be controlled by their cost effectiveness, and the reliability of microchips linked to machinery which is designed to work under field conditions. For experimentation, it must be remembered that the most common reason for yield variations within a field is soil type. Boundaries between different soil textures were formerly defined by hedgerows, thus it may be easier to consult historical farm maps before using satellite technology. At present this exciting technology is of little value for choosing the position of an experimental site within a field. Background variation is still best defined by conventional soil analysis and historical research, and ultimately controlled by the correct choice of experimental design.
1.6 SAMPLING
A crop sample is a small portion of a population taken for detailed study. It may be a length of row, quadrat area, a number of plants or pots taken at random. Hopefully, it will be representative (large) enough to inform the researcher what he or she needs to know about the whole population of a particular treatment.
Some crop-sampling procedures provide excellent exercises for improving physical fitness! Hand lifting, bagging and labelling samples of potatoes and sugar beet requires stamina on hot summer days. Locating and then removing quadrat areas of oilseed rape from dense, tangled and lodged crops is a challenge of patience and technical skill for the research agronomist. It is important to prepare bags and labels before going into the field, and to check that each plot has been allocated a sample bag (using the field plan) before starting work. Luggage labels made from cardboard are ideal — if felt tip pens are used check that the ink is waterproof. If cold storage facilities are not available, it is best to process samples block by block — assuming a block design has been used (Chapter 10). This minimises problems associated with wilting and loss of dry matter.
As statistical packages are now readily available, it is tempting to carry out data analyses before examining the form of distribution that is associated with the sampled data. This examination is highly recommended. Crop experimentation encompasses both discrete and continuous distributions. Variables such as number of branches, number of pods per plant and number of seeds per pod have discrete distributions, while those such as plant height and dry weight have continuous distributions (Chapters 2 and 3).
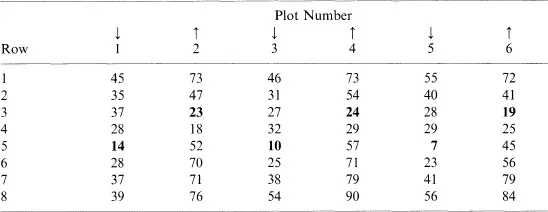
Sampling schemes should only be agreed after a careful assessment has been made of plant establishment. They must avoid bias, but at the same time take into account variability in establishment possibly caused by poor drill calibration. The number of plants in individual rows of adjacent plots of winter wheat is shown in Table 1.1.
There are large differences between rows within each plot with rows 5 and 3 having the lowest plant populations. The position of these two rows varied according to the direction of drilling, the problem having mainly arisen due to shallower coulter depth. In this experiment the background variation in establishment was high, and as a result a random sampling system based on a length of one row would have been inappropriate. Instead, a quadrat area encompassing eight rows was randomly removed on each sampling occasion following establishment. It is always important to determine the reliability of the sampling system by examining the level of variation in plant establishment between replicate samples taken from the same treatment.
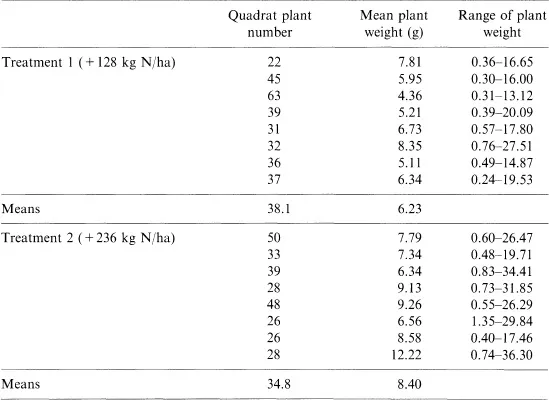
The morphology of individual crop plants varies widely in an unevenly established crop. Between-plant variation (plot background variation) is especially problematic to sampling procedures in poorly established precision-sown or transplanted crops such as maize and tobacco. Sampling difficulties encountered in many field experiments are clearly illustrated by data obtained from two experimental plots of winter oilseed rape. Quadrat samples (0.33 m2) were randomly taken when the lowermost terminal raceme buds were yellowing. The individual dry weights of all plants were recorded and the background variation is summarised in Table 1.2.
Table 1.1. The number of winter wheat plants in six plots and individual rows (replicate 1) of 0.5 m prior to the application of husbandry treatments
Table 1.2. Ranges of plant dry weights (g)
For both nitrogen fertiliser treatments the numbers of plants varied widely, and each quadrat contained a number of very small and large specimens. Possible treatment differences may not have been detected if only small plants had been subsampled from each quadrat for growth analysis. It is essential to use a subsampling system which eliminates bias because in practice there is always a tendency to avoid large plants as their subsequent analysis in the crop laboratory is time consuming.
The wide range of plant-to-plant variation shown in Table 1.2 cannot be quantified accurately if only small numbers of plants are studied. Yet subsample sizes in many research papers on rapeseed agronomy and physiology have only consisted of 3–20 plants per treatment. A detailed statistical study of data given in Table 1.2 indicated that for the sample mean plant weight to be within 1 g of the true weight (with 95% confidence), a random sample of approximately 600 plants would be required! As this is time consuming it again raises the question of the value of overcollecting descriptive data unless the accuracy of a sampling system is known. In System 2 it may be better to minimise the time invested in crop description (traditional growth analysis), in order to study in more detail environmental and physiological parameters affecting canopy development and crop yield. The latter approach (crop modelling), has been made more accessible with the availability of field recording equipment which is directly linked to computers.
Although statisticians will always recommend random sampling, this may not be practical in tall, high-density plots of crops such as oilseed rape without causing damage to surrounding areas. In this situation it may be wiser to adopt a ‘step-ladder’ sampling system in which a quadrat enclosing inner plot rows is first removed from a uniform area at either the top or bottom of each experimental plot. After leaving a discard distance a second quadrat can be removed on a later date using the first sampled area as a working base. This process can then be repeated. An unsampled, undisturbed area of plot must be left for commercial yield assessment. However, the importance of selecting the sampling units in such a way that they shall be as representative as possible of the entire population cannot be overemphasised.
![]()
Chapter 2
Basic Statistical Calculations
2.1 INTRODUCTION
When all statistical analyses were carried out using hand-operated calculators, the amount of experimental data collected and analysed was partly controlled by the sluggishness of early desk machinery. Because each analysis may have taken many minutes or even hours to complete, raw data were pondered in detail before calculations were attempted.
Package computer programs have revolutionised attitudes to data-collection and data-handling systems in applied biological res...