Becoming an architect is a daunting task. Beyond the acquisition of new skills and procedures, beginning designers face an entirely unfamiliar mode of knowledge: design thinking.
In Diagramming the Big Idea, Jeffrey Balmer and Michael T. Swisher introduce the fundamentals of design thinking by illustrating how architects make and use diagrams to clarify their understanding of both specific architectural projects and universal principles of form and order. With accessible, step-by-step procedures that interweave diagrams, drawings and virtual models, the authors demonstrate how to compose clear and revealing diagrams.
Design thinking defines a method for engaging the world through observation and analysis. Beyond problem solving, design is a search for possibilities. Mastering design thinking begins with learning the fundamentals of visual composition. It embraces the ability to synthesize deductive and imaginative reasoning, combining both shrewd scrutiny and fevered speculation.
Design diagrams make visible the abstractions that order the built environment. Premised upon the Beaux-Arts notion of the architectural parti, Balmer and Swisher adopt the 'Big Idea' as a foil and as a suitcase to organize fundamentals of architectural composition. The goal of this book is to make explicit to students what they are learning, why they are learning it and how to internalize such lessons toward their lifelong development as designers.
Preguntas frecuentes
¿Cómo cancelo mi suscripción?
Simplemente, dirígete a la sección ajustes de la cuenta y haz clic en «Cancelar suscripción». Así de sencillo. Después de cancelar tu suscripción, esta permanecerá activa el tiempo restante que hayas pagado. Obtén más información aquí.
¿Cómo descargo los libros?
Por el momento, todos nuestros libros ePub adaptables a dispositivos móviles se pueden descargar a través de la aplicación. La mayor parte de nuestros PDF también se puede descargar y ya estamos trabajando para que el resto también sea descargable. Obtén más información aquí.
¿En qué se diferencian los planes de precios?
Ambos planes te permiten acceder por completo a la biblioteca y a todas las funciones de Perlego. Las únicas diferencias son el precio y el período de suscripción: con el plan anual ahorrarás en torno a un 30 % en comparación con 12 meses de un plan mensual.
¿Qué es Perlego?
Somos un servicio de suscripción de libros de texto en línea que te permite acceder a toda una biblioteca en línea por menos de lo que cuesta un libro al mes. Con más de un millón de libros sobre más de 1000 categorías, ¡tenemos todo lo que necesitas! Obtén más información aquí.
¿Perlego ofrece la función de texto a voz?
Busca el símbolo de lectura en voz alta en tu próximo libro para ver si puedes escucharlo. La herramienta de lectura en voz alta lee el texto en voz alta por ti, resaltando el texto a medida que se lee. Puedes pausarla, acelerarla y ralentizarla. Obtén más información aquí.
¿Es Diagramming the Big Idea un PDF/ePUB en línea?
Sí, puedes acceder a Diagramming the Big Idea de Jeffrey Balmer, Michael Swisher en formato PDF o ePUB, así como a otros libros populares de Architecture y Architecture Design. Tenemos más de un millón de libros disponibles en nuestro catálogo para que explores.
Students often raise their eyebrows – and their hands – when we show them how to generate proportional objects using a compass and a straight-edge. They ask us, ‘Can’t you just do this on the computer?’ The answer reveals an inherent difference between geometry and arithmetic algebra – mathematics. Geometry is physical and spatial, while mathematics is number-based and linguistic in character.
The diagonal lines of a geometric drawing often give rise to irrational numbers – something that computers only approximate. The reason for this limit is structural. The logic of the computer – its language of zeros and ones and its method of visualization – has as its framework rational numbers and the rational grid.
We mention this because the pervasiveness of the rational grid in everyday life obscures both its Modernism and its brilliance. The imposition of the even, infinite and regular structure of the grid is no mere coincidence. It is a singular manifestation of a belief in the possibility of a rational life. What makes it Modernist resides in the philosophical proposition that rationality and its methods will lead to a final evolutionary state of humanity and that the struggle between opposites will eventually resolve itself into a better world. These sorts of post-Enlightenment beliefs remind us that invoking the Modernist grid is not a neutral act. It aligns the grid with an emerging sense of Progress, as well as rationality.
That said, one does not have to agree with that view of destiny to use a rational grid. In this project, we use this grid as the basis for our investigations because the forms that are probable, as well as the means for developing them, alter when the rational grid replaces the proportional scheme governing PROJECT 2. The differences can prompt meaningful formal discussion. In addition, the ubiquity of the ‘universal grid’ introduces an important concept for beginning design students to consider.
A number of architects have worked at the interface between proportionality and whole-number thought. Although the grid as we know it may be modern, its underlying logic is ancient – recall the plan of Chengzhou (p.56). Interest in resolving the difference between the rational and irrational emerges most fully in the West with the onset of the Renaissance. This predates the Cartesian grid of the Enlightenment, arising as an important idea for architects such as Alberti, in his attempt to reconcile Greek measure with whole number geometries.
*FIBONACCI SERIES
Any series of numbers wherein each number is the sum of the two preceding numbers. The simplest series begins with the number 1 and proceeds thus: 1, 1, 2, 3, 5, 8, 13, 21 etc.
Later, modern architects such as Mies van der Rohe and Giuseppe Terragni revisited the proportions of the golden ratio – an irrational number – in the context of whole number measurements and grids. In the case of Terragni, he utilized in his Danteum the Fibonacci series, a system of whole numbers that approximate the golden section.* This famous project – the work of Giuseppe Terragni with Pietro Lingeri and Mario Sironi in 1938 – exists only as drawings and models. In the Danteum, ideal geometry underwrites both symbolic and compositional expression. In CHAPTER 9, we examine the project as a significant example of combined rational and irrational geometries.
The structure that we use for PROJECT 3 borrows Terragni’s approach. We measure the ground using the universal Cartesian grid, while the figures gain their size and scale from the earliest part of the Fibonacci series.
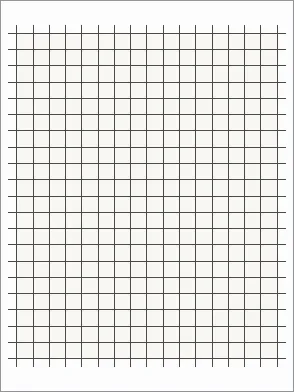
Figure 1: The base-centered grid as it appears on the 9″×12″ page. The color scheme color provides contrast for clarity in the example.
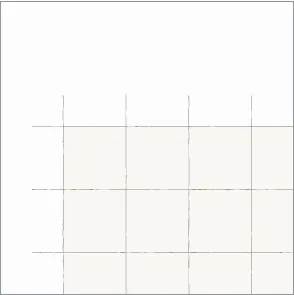
Figure 2: Enlarged portion of the grid showing the interval and extended lines at the upper left corner.
The site
The most apparent formal issue present within the universal grid is the reliance on constant intervals. Measurements are largely additive and orthogonal. Simply put, we measure by counting. To facilitate that approach, the ‘site’ for this project is an 8″×10″ grid, drawn within a 9″×12″ field. The grid defines the smaller rectangle centered on the larger page (1). The instructions for making the grid follow simple guidelines:
· Draw the base grid as light lines set at half-inch intervals.
· Extend each line one-quarter inch beyond the 8″×10″ space on all sides as shown in the example (2).
For the project, we generally stipulate some practical matters:
· Draw all lines lightly in pencil.
· Make five copies.
Three figures
On each of the drawn grids, we place three figures. Each is cut from yellow trace – for transparency – and attached with small strips of drafting tape – approximately ⅛″× ½″ – to a 9″×12″ sheet of white transpar...