Analysis and Application of Analog Electronic Circuits to Biomedical Instrumentation
Robert B. Northrop
This is a test
This is a test
Partager le livre
578 pages
English
ePUB (adapté aux mobiles)
Disponible sur iOS et Android
eBook - ePub
Analysis and Application of Analog Electronic Circuits to Biomedical Instrumentation
Robert B. Northrop
Détails du livre
Aperçu du livre
Table des matières
Citations
À propos de ce livre
Analysis and Application of Analog Electronic Circuits to Biomedical Instrumentation, Second Edition helps biomedical engineers understand the basic analog electronic circuits used for signal conditioning in biomedical instruments. It explains the function and design of signal conditioning systems using analog ICs-the circuits that enable ECG, EEG,
Foire aux questions
Comment puis-je résilier mon abonnement ?
Il vous suffit de vous rendre dans la section compte dans paramètres et de cliquer sur « Résilier l’abonnement ». C’est aussi simple que cela ! Une fois que vous aurez résilié votre abonnement, il restera actif pour le reste de la période pour laquelle vous avez payé. Découvrez-en plus ici.
Puis-je / comment puis-je télécharger des livres ?
Pour le moment, tous nos livres en format ePub adaptés aux mobiles peuvent être téléchargés via l’application. La plupart de nos PDF sont également disponibles en téléchargement et les autres seront téléchargeables très prochainement. Découvrez-en plus ici.
Quelle est la différence entre les formules tarifaires ?
Les deux abonnements vous donnent un accès complet à la bibliothèque et à toutes les fonctionnalités de Perlego. Les seules différences sont les tarifs ainsi que la période d’abonnement : avec l’abonnement annuel, vous économiserez environ 30 % par rapport à 12 mois d’abonnement mensuel.
Qu’est-ce que Perlego ?
Nous sommes un service d’abonnement à des ouvrages universitaires en ligne, où vous pouvez accéder à toute une bibliothèque pour un prix inférieur à celui d’un seul livre par mois. Avec plus d’un million de livres sur plus de 1 000 sujets, nous avons ce qu’il vous faut ! Découvrez-en plus ici.
Prenez-vous en charge la synthèse vocale ?
Recherchez le symbole Écouter sur votre prochain livre pour voir si vous pouvez l’écouter. L’outil Écouter lit le texte à haute voix pour vous, en surlignant le passage qui est en cours de lecture. Vous pouvez le mettre sur pause, l’accélérer ou le ralentir. Découvrez-en plus ici.
Est-ce que Analysis and Application of Analog Electronic Circuits to Biomedical Instrumentation est un PDF/ePUB en ligne ?
Oui, vous pouvez accéder à Analysis and Application of Analog Electronic Circuits to Biomedical Instrumentation par Robert B. Northrop en format PDF et/ou ePUB ainsi qu’à d’autres livres populaires dans Medicina et Biotecnología en medicina. Nous disposons de plus d’un million d’ouvrages à découvrir dans notre catalogue.
Before describing and analyzing the electronic circuits, amplifiers, and filters required to condition the signals found in clinical medicine, biomedical research, and physiology, it is appropriate to describe the sources and properties of these signals (i.e., their bandwidths, amplitude distributions, and noisiness). Broadly speaking, biomedical signals can be subdivided into two major classes: (1) Endogenous signals, which arise from natural physiological processes and which are measured within or on the surface of living creatures (examples include electrocardiogram (ECG), electroencephalogram (EEG), respiratory rate, temperature, blood pressure, blood glucose). (2) Exogenous signals that are applied from without (generally noninvasively) to measure internal structures and physiological parameters. These include, but are not limited to, ultrasound (imaging and Doppler), X-rays (CAT scans), and monochromatic light (such as the two wavelengths used in transcutaneous pulse oximeters, excitation of fluorescence from fluorophore-tagged cells and molecules stimulated with blue or near UV light, optical coherence tomography (OCT), laser Doppler velocimetry (LDV) used to measure blood velocity, and the strong magnetic fields used in magnetic resonance imaging (MRI)). For many other examples of exogenous signals refer to Northrop (2002).
In the following section, the properties of endogenous bioelectric signals used in medical diagnosis, care, and research are examined.
1.2 SOURCES OF ENDOGENOUS BIOELECTRIC SIGNALS
The sources of nearly all bioelectric signals are transient changes in the transmembrane potential observed in all living cells. In particular, bioelectric signals arise from the time-varying transmembrane potentials seen in nerve cells (neuron action potentials and generator potentials) and in muscle cells, including the heart and smooth muscles. The electrochemical basis for transmembrane potentials in living cells lies in several phenomena: First, cell membranes are semipermeable. That is, they have different transmembrane conductances and permeabilities for different ions and molecules (e.g., Na+, K+, Ca++, Cl−, glucose, and proteins). Second, cell membranes contain “ion pumps” driven by metabolic energy (e.g., ATP). The ion pumps actively transport ions and molecules across cell membranes against energy barriers set up by the transmembrane potential and/or concentration gradients between the inside and outside of the cell. In the steady state, there is a continual leakage of ions into a cell (e.g., Na+), out of a cell (e.g., K+), and ongoing ion pumping to restore the steady-state concentrations. In the widely studied squid giant axons, the steady-state internal concentrations are as follows: [Na+]i = 50 mM, [K+]i = 400 mM, and [Cl−]i = 52 mM. The steady-state external concentrations (in extracellular fluid) are as follows: [Na+]e = 440 mM, [K+]e = 20 mM, [Cl−]e= 560 mM, and [A−]i = 385 mM (Kandel et al. 1991). [A−] is the equivalent concentration of large, impermeable protein anions in the cytosol. Ion concentration data exist for the neurons and muscles of a variety of invertebrate and vertebrate species (Kandel et al. 1991; Katz 1966; West 1985).
The steady-state transmembrane potential can be modeled by the Goldman–Hodgkin–Katz equation (Guyton 1991):
where T is the Kelvin temperature, R is the MKS gas constant (8.314 J/(mol K)), F is the Faraday number, 96,500 Cb/mol, and PX is the permeability for ion species X.
The resting transmembrane potential of neurons, Vmo, varies with species, neuron type, ionic environment, and temperature. It can range from ca. 60 to 90 mV, inside negative with respect to outside. Muscle cells also have transmembrane potentials, ca. 80 < Vmo < 95 mV, inside negative, for human muscles.
1.3 NERVE ACTION POTENTIALS
Nerve action potentials (APs) are, in general, the result of transient changes in specific ionic conductances and permeabilities induced in the nerve cell membrane electrically or chemically by neurotransmitters. In excitable neuron membranes, an increase in cell membrane sodium permeability leads to a depolarization of the transmembrane potential (i.e., sodium ions flow rapidly into the neuron’s cytoplasm down a concentration gradient and electric field). The inrush of Na+ through the membrane causes the normally negative transmembrane voltage Vm to go positive, which is a depolarization. When the excitable nerve transmembrane voltage reaches a depolarization threshold, which is on the order of a few millivolts more positive than the resting potential, the permeability events that lead to a propagating action potential or nerve spike begin to occur. First, there is a further, “all-or-nothing,” large transient increase in sodium permeability causing a strong transient inrush of Na+ ions. This Na+ inrush causes a large, rapid depolarization so that Vm actually goes positive by 10s of mV, generally in less than a millisecond. Immediately, permeability to K+ ions also increases, but at a slower rate, which causes an outward potassium ion current density,
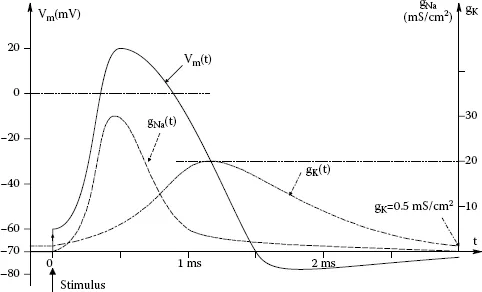
, causing Vm to decrease from its positive peak to its negative resting value after a slight, transient undershoot (hyperpolarization). The total duration of the nerve action potential spike, including recovery to the SS Vm, is on the order of 2.5–3 ms. Once initiated, an action potential propagates down a neuron’s axon at a velocity that depends on a number of physical and chemical factors, including the diameter of the axon. One of the earliest mathematical models for nerve impulse generation was given by Hodgkin and Huxley (1952). The H-H model now appears to be somewhat oversimplified with its description of a single type of potassium channel, but is still valid, and is a useful model to demonstrate the dynamics of nerve impulse generation. Figure 1.1 illustrates the result of a computer simulation of the H-H model using Simnon™ (Northrop 2001). Shown is the transmembrane voltage, Vm(t), and the time-varying conductances for Na+ and K+. Readers interested in pursuing the molecular and ionic details of neurophysiology should consult the texts by Kandel et al. (1991), West (1985), Guyton (1991), and Northrop (2001).
Most neurons in the vertebrate central nervous system (CNS) are too small to directly record their transmembrane potentials with glass micropipette electrodes. However, their action potentials can be recorded over long periods of time with extracellular, metal microelectrodes whose uninsulated tips are in the neuropile within several micrometers of axons or cell bodies. Action potentials from peripheral nerve bundles can be recorded with simple platinum hook electrodes, saline-filled suction electrodes, or saline-wetted wick electrodes coupled to silver/silver chloride electrodes. All extracellular recording techniques suffer from the problem that the electrodes pick up nerve spikes from active, adjacent, or neighboring neurons. This neural background noise is added to the desired unit’s signal and, unfortunately, has the same bandwidth as the desired unit’s spikes. In dissected peripheral nerve fibers, it may be possible to isolate single axons with hook, suction, or wick electrodes, greatly improving the recording signal-to-noise ratio (SNR).
FIGURE 1.1 Results of a Simnon™ simulation of the Hodgkin–Huxley 1952 mathematical model for nerve action potential generation (Northrop, R.B., Introduction to Dynamic Modeling of Neuro-Sensory Systems. CRC Press, Boca Raton, FL, 2001.) Traces shown: vm(t) (transmembrane potential) in mV. gK(t, vm) in mS/cm2. gNa(t, vm) in mS/cm2. Time in ms.
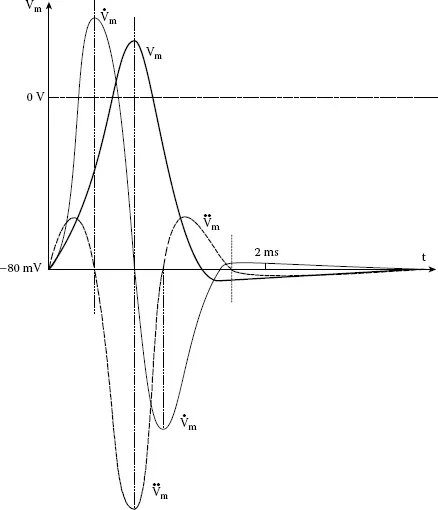
Because the nerve action potential is a traveling wave, it can be shown that an external electrode in close proximity to the outside surface of an axon (the second, (reference), (−) electrode is located remotely from the axon) will respond to the passage of the AP with an electric potential waveform that has in effect, the shape of the second derivative of the transmembrane spike waveform (Plonsey 1969), as shown in Figure 1.2. (The intracellular AP, Vm, is to scale, but its derivatives are not to scale.) The triphasic (second derivative) waveform of the AP recorded at a point near the axon comes from the fact that the AP is traveling along the axon with velocity, v. As the AP approaches the electrode, a weak, net outward
causes a low positive voltage peak. When the AP has moved opposite the electrode, the electrode responds to the strong inward flow of JNa with a large negative voltage peak. Then, as the AP passes the electrode, its potential again goes positive from the net outward
in the recovery phase of the AP.
In the author’s experience, using fine platinum–iridium extracellular microelectrodes (which were glass insulated down to 6–12 μm of their conical tips), we were able to record from single units in insect optic lobes and protocerebrum, and in frog tectum, with major spike amplitudes ranging from −50 to −500 μV. Midband gain for signal conditioning was 104, and signal conditioning bandwidth was typically 100 to 3000 Hz (Northrop and Guignon 1970).
Nerve APs recorded through the neuron membrane (in the cell body, base of dendrites, or axon) using glass micropipette electrodes can be ca. 100 mV or more, peak-to-peak. A capacity-neutralized, electrometer head stage used to couple the high resistance microelectrode generally has a gain of 2 or 3; the second stage may have gain from 5 to 30, so the overall gain can range from 10 to 90. Bandwidth is generally from dc to 3–5 kHz. The direct coupling is required because we are generally interested in the neuron’s resting potential, Vmo, or slow changes in Vm caused by incoming excitatory or inhibitory signals. If we are not interested in Vmo, then it is technically simpler and less noisy to use extracellular microelectrodes and band-pass filtering (e.g., 100 Hz to 3 kHz). More amplifier gain will be required with external electrodes, however.
FIGURE 1.2 A nerve action potential and its first and second time derivatives (derivatives not to scale).
1.4 MUSCLE ACTION POTENTIALS
1.4.1 Introduction
An important bioelectric signal that has diagnostic significance for many neuromuscular diseases is the electromyogram (EMG), which can be recorded from the skin surface with electrodes identical to those used for electrocardiography, although in some cases, the electrodes have smaller areas than those used for ECG (<1 mm2). To record from single motor units (SMUs), or even individual muscle fibers (several of which comprise a SMU), needle electrodes that pierce the skin into the body of a superficial muscle can also be used. (This semi-invasive method obviously requires sterile technique.) EMG recording is used to diagnose some causes of muscle weakness or paralysis, muscle or motor problems such as tremor or twitching, motor nerve damage from injury or osteoarthritis, and pathologies affecting motor end plates (myoneural junctions).
1.4.2 The Origin of EMGs
There are three types of muscle in the body, viz, striated, cardiac, and smooth. Striated muscle in mammals can be further subdivided into fast and slowmuscles (Guyton 1991). Fast muscles are used for fast movements; they include, for example, the two gastrocnemii, laryngeal muscles, the extraocular muscles. Slow muscles are used for postural control against gravity; they include the soleus, abdominal muscles, back muscles, neck muscles, and so on. EMG recording is generally carried out on both slow and fast skeletal muscles. It can also be done on less superficial muscles such as the extraocular muscles that move the eyeballs, the eyelid muscles, and the muscles that work the larynx.