![]()
PART 1
SHAPES
![]()
1
The Beauty of Romanesco Broccoli
MATHEMATICAL CONCEPT: SELF-SIMILARITY
HAVE YOU EVER looked closely at the fruits and vegetables in your local supermarket? Some of them are creepy: the yellow Buddha’s hand, for instance, looks like a squid creature from an H.P. Lovecraft story. Others are strangely beautiful. Sweet potatoes have a wonderful lumpiness like misshapen hunks of clay; onions have nesting rings like those found in trees; and when you slice open an apple, you can see that the seeds are arranged in a star-shaped configuration that’s oddly pleasing. Even ornamental cabbage—which is sold at garden stores—has a kind of geometric attractiveness.
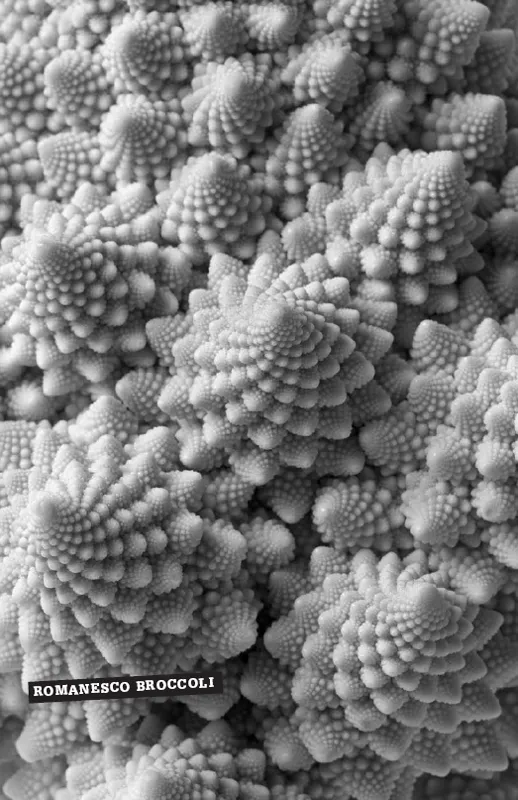
But nothing in the produce aisle beats the Romanesco broccoli for the ultimate in vegetable beauty. In fact, it’s hard to take your eyes off it. The Romanesco, a type of Brassica oleracea, or cabbage, has the general shape of a pinecone, but its surface is a riot of smaller pinecone shapes, and on the surface of each of those cones are more cones, and so on. Each of the smaller surface cones looks like the larger, original cone, so much so that if you were to lop off a surface cone, photograph it, and place the photo next to an image of the entire broccoli, it would be difficult to tell which was which.
Mathematicians would say that the shape of the Romanesco is self-similar: if you zoom in on the shape and look closely at a detail, what you see is the same as if you hadn’t zoomed in at all. Self-similarity—when an object looks the same no matter the scale—is also a distinguishing feature of fractals, a kind of shape studied and popularized by mathematician Benoit Mandelbrot. His 1982 book, The Fractal Geometry of Nature, helped introduce this species of object to the world. (The book was largely a revision of his 1977 book called Fractals: Form, Chance and Dimension.) Mandelbrot identified lots of shapes in nature that have this self-similar quality: jagged coastlines, clouds, and the exquisite tracery of veins in a leaf. Nature seems to like self-similar shapes; the more you look for them, the more you find.
THE MANDELBROT SET
Benoit Mandelbrot also studied something that’s now called the Mandelbrot set, a set of complex numbers in a sequence that does not approach infinity. When you plot the Mandelbrot set on a graph, it can take on a bulbous shape with a captivating beauty, which is interesting to mathematicians in part because the more you zoom in on any part of it, the more detail you see. In fact, as you zoom, you start to see the original Mandelbrot set shape over and over again.
![]()
2
Measuring the Length of a Coastline: Not as Easy as It Sounds
MATHEMATICAL CONCEPT: MEASUREMENT
WHAT COULD BE MORE straightforward than measuring how long something is? If we want to figure out the length of a table, for instance, we can use a measuring tape. If we want to determine the distance from one town to another, we can drive a car and note the change in the odometer. Or we can get a road map, use a ruler to measure the distance between the two towns, and then use the map’s scale to convert inches to miles, or centimeters to kilometers.
But measuring the length of a coastline is more complicated. It turns out that the length of any particular coastline depends on the length of the unit used to measure it. In general, the smaller the measuring unit, the longer the coastline. And in principle, as the measuring unit gets smaller and smaller, the length of a coastline increases to infinity. How can this be?
Like many forms in nature, coastlines are irregular and jagged. Thus, as you zoom in on one you notice more and more detail. If you were peering down at North America from the height of a satellite, for example, the coastline would appear relatively smooth and feature-free. But if you were measuring a coastline by walking, you would observe river inlets, small spits of land, and rocks, among other features. Then, if you were to get on your hands and knees, you could start to account for pebbles and leaves. And if you were to use a microscope, your measurements could include molecules. At each new level of detail, the unit of measurement shrinks, from kilometer to meter to centimeter to micrometer; and each time, the amount of territory to measure increases. If you were to measure the coastline of Great Britain using a stick 100 kilometers (about 62 miles) long, the resulting distance would be more like 2,800 kilometers (approximately 1,700 miles). But if you reduced your measuring stick to 50 kilometers (31 miles), the new total coastline distance would be 3,400 kilometers (2,100 miles).
The coastline paradox illustrates how even though mathematics makes possible measurements of extraordinary precision, it can also reveal fuzziness inherent in the very structure of reality.
CANADIAN COAST
Canada has the longest coastline of any country in the world, at 152,100 miles. But just imagine how much longer it might be if you were to measure the whole thing using a yardstick.
![]()
3
Bubbles Are Fun and Efficient
MATHEMATICAL CONCEPT: VOLUME
IMAGINE A SUNNY DAY in the park during the summer. Chances are, a kid there is playing with soap bubbles. Whether you make them using a plastic wand or a large hoop made out of straws and string, soap bubbles—with their shimmery surfaces and blobby shapes—are the airborne embodiment of fun.
They are also a wellspring of mathematical pondering. Mathematicians have known for a long time that if you want to enclose a given volume of air in a shape with the least surface area, that shape is a sphere. But what if you want to enclose two volumes of air? The hunch was that the best way was to use a double bubble. A double bubble is the shape that’s formed when two bubbles join. (You’ve probably seen one if you’ve ever taken a bubble bath.) Usually, the bubbles are separated by a flat membrane; if one bubble is larger than the other one, then the membrane pushes slightly into the bigger bubble. In 1995, mathematicians Joel Hass, Michael Hutchings, and Roger Schlafly published a paper with a proof that the double-bubble shape is the most efficient way to enclose two equal volumes of air. But what if the two volumes of air aren’t equal? Is the double-bubble shape still the way to enclose them using the least amount of surface area?
The answer is yes. In 2000, mathematicians Frank Morgan, Michael Hutchings, Manuel Ritoré, and Antonio Ros published a proof that gave a much more general result, showing that the double-bubble shape is the best way to enclose any two volumes of air using the least amount of surface area. They showed that the double bubble uses less surface area than countless other configurations that two joined bubbles can take, including a weird case in which one bubble wraps around the other’s midsection, like a donut. (In mathematics, the donut shape has a special name—torus—and pops up in the subfield of topology.) Moreover, this math team created their proof without using a computer.
This is one of those cases when mathematics can use reason to probe the workings of nature to learn its secrets. All you need is paper and a pencil.
THE MARANGONI EFFECT
Soap bubbles last longer than bubbles made of other materials, like pure water, because of the Marangoni effect, which describes the flow of material along the boundaries of areas with different degrees of surface tension. It’s named for Italian physicist Carlo Marangoni, who published his findings in 1865. Basically, when it comes to soap, the Marangoni effect actually stabilizes the bubble’s boundaries, making it stronger and longer lasting than a regular bubble.
![]()
4
Is There Math Behind Jackson Pollock’s Paintings?
MATHEMATICAL CONCEPT: FRACTALS
JACKSON POLLOCK created some of the most iconic paintings of the twentieth century, and some researchers have argued that their appeal stems from mathematics. Specifically, scientists have argued that the drip paintings Pollock completed in the 1940s incorporate fractals, which are geometric patterns that repeat at both small and large scales. Some also argue that Pollock’s works are especially captivating because they seem to capture some of the fractal qualities of our environment. (Fractals occur frequently in nature, like within the texture of a cloud.)
Fractals have dimensions, just as lines (one dimension) and beach balls (three dimensions) do, but unlike those objects, fractals often have dimensions that include decimals. In general, mathematicians categorize fractal dimensions according to a scale that goes from 0 to 3. Some one-dimensional fractals, like a segmented line, have fractal dimensions of 0.1 to 0.9. Two-dimensional fractals, like the contour of a coastline, have fractal dimensions ranging from 1.1 to 1.9. And three-dimensional fractals, like a head of cauliflower, have fractal dimensions of 2.1 to 2.9.
In the late 1990s, physicist Richard Taylor noticed that Pollock’s drip paintings seemed to have fractal properties, and proposed that one could measure the fractal characteristics of Pollock’s work. Using a specific kind of analysis, a person could conceivably figure out whether any painting was created by Pollock. Taylor’s technique involved scanning photographs of Pollock’s paintings into a computer and then overlaying a grid on top of the digital images. The computer then analyzed the painting, comparing patterns in boxes as large as the entire painting and as small as a fraction of an inch. Taylor found that Pollock’s painting did indeed incorporate fractals. For instance, one painting—Number 14—was determined to have a fractal dimension of 1.45, which matches the dimension of many coastlines.
Years later, though, researchers at Case Western Reserve University in Cleveland found evidence that Taylor’s technique did not seem to reliably identify Pollock’s work. One doctoral student discovered that a rough sketch of stars she created using Adobe Photoshop passed Taylor’s test. Another study found that two paintings by Case Western undergraduates also passed Taylor’s test, while two authentic Pollocks did not. The researchers concluded that the test did not include a wide enough range of boxes to sufficiently determine whether any particular painting was a Pollock.
PIET MONDRIAN
For a more straightfo...