Pictures, Diagrams and the Pursuit of Shared Meaning
Jonathan Whelan, Stephen Whitla
This is a test
This is a test
Compartir libro
216 páginas
English
ePUB (apto para móviles)
Disponible en iOS y Android
eBook - ePub
Visualising Business Transformation
Pictures, Diagrams and the Pursuit of Shared Meaning
Jonathan Whelan, Stephen Whitla
Detalles del libro
Vista previa del libro
Índice
Citas
Información del libro
Business transformation typically involves a wide range of visualisation techniques, from the templates and diagrams used by managers to make better strategic choices, to the experience maps used by designers to understand customer needs, the technical models used by architects to propose possible solutions, and the pictorial representations used by change managers to engage stakeholder groups in dialogue. Up until now these approaches have always been dealt with in isolation, in the literature as well as in practice. This is surprising, because although they can look very different, and tend to be produced by distinct groups of people, they are all modelling different aspects of the same thing. Visualising Business Transformation draws them together for the first time into a coherent whole, so that readers from any background can expand their repertoire and understand the context and rationale for each technique across the transformation lifecycle. The book will appeal to a broad spectrum of readers involved in change, whether that is by creating change models themselves (strategists, architects, designers, engineers, business analysts, developers, illustrators, graphic facilitators, etc.), interpreting and using them (sponsors, business change managers, portfolio/programme/project managers, communicators, change champions, etc.), or supporting those involved in change indirectly (trainers, coaches, mentors, higher education establishments and professional training facilities).
Preguntas frecuentes
¿Cómo cancelo mi suscripción?
Simplemente, dirígete a la sección ajustes de la cuenta y haz clic en «Cancelar suscripción». Así de sencillo. Después de cancelar tu suscripción, esta permanecerá activa el tiempo restante que hayas pagado. Obtén más información aquí.
¿Cómo descargo los libros?
Por el momento, todos nuestros libros ePub adaptables a dispositivos móviles se pueden descargar a través de la aplicación. La mayor parte de nuestros PDF también se puede descargar y ya estamos trabajando para que el resto también sea descargable. Obtén más información aquí.
¿En qué se diferencian los planes de precios?
Ambos planes te permiten acceder por completo a la biblioteca y a todas las funciones de Perlego. Las únicas diferencias son el precio y el período de suscripción: con el plan anual ahorrarás en torno a un 30 % en comparación con 12 meses de un plan mensual.
¿Qué es Perlego?
Somos un servicio de suscripción de libros de texto en línea que te permite acceder a toda una biblioteca en línea por menos de lo que cuesta un libro al mes. Con más de un millón de libros sobre más de 1000 categorías, ¡tenemos todo lo que necesitas! Obtén más información aquí.
¿Perlego ofrece la función de texto a voz?
Busca el símbolo de lectura en voz alta en tu próximo libro para ver si puedes escucharlo. La herramienta de lectura en voz alta lee el texto en voz alta por ti, resaltando el texto a medida que se lee. Puedes pausarla, acelerarla y ralentizarla. Obtén más información aquí.
¿Es Visualising Business Transformation un PDF/ePUB en línea?
Sí, puedes acceder a Visualising Business Transformation de Jonathan Whelan, Stephen Whitla en formato PDF o ePUB, así como a otros libros populares de Negocios y empresa y Negocios en general. Tenemos más de un millón de libros disponibles en nuestro catálogo para que explores.
As the corporate world changes, so too does the world of ‘change’ itself. In the past, any significant change would generally involve a large-scale, top-down transformation programme. These large-scale programmes are now often seen as single points of failure. Waterfall is out, agile is in. ‘Design’ is no longer just a downstream activity driven by strategy – strategy is increasingly led by design thinking. Leaders, feeling that they are falling behind the pace of change, are attracted to Scrum practitioners who promise ‘twice as much in half the time’. What all these practices have in common is that they put the organisation’s users and customers at the heart of the change, designing products, services, processes and ultimately strategy with users and customers rather than in isolation from them.
The reason these agile approaches have become popular is that they work! The reason they are controversial is that they only seem to work consistently on a relatively small scale. There are plenty of consultancies, frameworks, white papers and blogs proposing the means to scale the ‘agile mindset’ from teams of ten to organisations of tens of thousands, but the results are, in our experience, too often inconclusive.
Why is this? Why is it that the larger organisations become, the less agile they tend to be? Why do older organisations find it harder to change? There are lots of valid answers involving culture, leadership, clarity of purpose, organisational design, environmental couplings, legacy IT systems and so on. The answer we want to focus on in this book involves models, in particular the visual models people create to make sense of change and to describe change, along with the mental models these visuals reflect and inform.
This book is based on two underlying premises:
Visual models have the power to create shared meaning;
Shared meaning makes businesses more agile.
All organisations want agility, but any agile response presupposes a level of shared understanding and concern among employees and stakeholders as to what needs to happen, when, how and why. We believe that better models have the potential to allow the large organisations of tomorrow to reflect more of the agility of the small organisations of today.
Models break down complexity to help everyone involved and impacted by change get ‘on the same page’. Sometimes these models are explicitly written down and distributed, sometimes they are tacitly assumed, and other times they may be unconsciously embedded in the collective psyche, but without being shared to some degree, co-ordinated change isn’t possible. Or to put it another way: all other things being equal, the winners in a competitive market are more likely to be the companies whose staff have aligned mental models of what’s going on and how they are going to respond. It’s no use having the perfect solution to a business problem if it only exists in the mind of one person.
This explains why business innovation comes almost exclusively from small organisations, be they start-ups or ‘skunkworks’ within larger enterprises. If you’re in an organisation of a dozen people working side by side, then it’s hard not to have a detailed shared model of what’s going on. Scale this up to 60,000 people and it becomes almost impossible. It’s also why design-led approaches have become so popular. If your change process has the customer/user at its heart and involves rapid iterations of ideas and prototypes to solve a problem, then it’s very hard as a small team not to have a shared model of what’s going on, because the customer is constantly telling you! The problem arises when you need to scale up your solution to be delivered by an enterprise for which that shared model doesn’t exist. Shared models will arise organically in any well-functioning small team but, humans being human, that’s often as far as they go. For large organisations to match the agility of smaller ones, we need to find ways to create models that travel across silo boundaries.
In this book we review state-of-the-art change modelling, taking in as wide a sample as possible of the different types of models people create to support change, and the eclectic ways that they are used. We look at the organisational paradigms that drive those uses and also drive divisions between the users. Throughout, we are constantly looking to the future and asking, ‘Can we do better than this?’ If models of change are such a key driver for transformation, then can we not make modelling tools – that is, the software tools that are used to create and maintain models – that are better suited and easily accessible to more people? Can’t we design modelling languages that break silos down rather than reinforcing them? At the very least, can’t we find ways to be respectful and curious about models that are made by different people and look dissimilar to the ones we might create ourselves?
To answer two possible objections before we start. Firstly, we are not saying that shared meaning is the only essential or desirable quality for a model; clearly, they also need to be accurate, relevant, appropriate and so on. What we are saying is that when it comes to achieving business transformation, shared meaning seems to be the crucial factor that is most often overlooked.
Secondly, ‘shared meaning’ does not mean everyone is thinking the same thing! Without a diversity of perspectives and opinions, organisations struggle because they cannot adapt to changing circumstances. The point is that without some shared model of what’s going on, divergent opinions themselves make no sense. You may have an ingenious solution to a customer problem, for example, but we can’t have a meaningful conversation about it unless we have a shared model of what that problem is.
The role of models and visualisation
Visualisations have been an important method of human communication for at least 35,000 years, from ancient painted drawings on cave walls and ceilings, to the symbols of Egyptian hieroglyphs and the pictograms of Chinese language characters. There are numerous scientific studies that indicate that humans have a better memory for diagrams than for words,1 a phenomenon sometimes called the ‘picture superiority’ effect.2 Certainly, our perception of the world is overwhelmingly visual; we spend half of our mental energy processing visual information.3
This is not to say that change should be described in diagrams alone, but clearly diagrams have a fundamental part to play. Any large-scale transformation will only be successful to the extent that it shifts the dominant mental model in the organisation to something new and different, and to do that we need to be able to represent what ‘new and different’ will look like, and why the status quo is no longer viable. The problem is that ‘new and different’ in the operation of a business usually refers to content that is non-linear, dynamic and complex which, as we will hopefully demonstrate, is almost impossible to represent succinctly using text alone, as text is linear and static. The medium simply doesn’t fit the message.
None of this is to denigrate the value of words! Change is fundamentally about people talking to one another, telling one another stories, making sense of what’s going on. But fundamental change involves people not just using words differently, but also using different words. The twentieth-century philosopher Richard Rorty argued that one of the distinguishing characteristics of all truly transformational episodes in human history has been the creation of new vocabularies, not just people arguing better using the old ones.4 Models are only helpful to the extent that they allow this to happen. Modelling change visually provides a way to engage people in what’s going on in a form they can more readily understand and make sense of in their own terms. Change requires that people engage in dialogue, that systems be examined, opinions articulated, options explored, innovation stimulated, designs proposed, uncertainty recognised, feelings expressed and so on. The dialogue that takes place when a model is created or communicated is often where the long-term value is, rather than the reference value of the model itself – as happens, for example, when relationships are established or strengthened between co-workers who attend a modelling workshop.
Like words, visual representations of models are also open to interpretation; the more abstract a model is, the further from reality it is, and the broader the interpretation may be of it – a model of a thing is not the thing itself. The question isn’t whether models are right or wrong, it’s whether or not they are helpful.
Key propositions of the book
Early in the development of this book we realised that we needed a way to compare and talk about the different types of models that each of us was used to, in a way that was both inclusive and complementary. There is an abundance of model types – or, more specifically, visualisation types – with each having its strengths and drawbacks in terms of accessibility, iconicity,5 breadth, complexity, familiarity, innovation, variety of uses and audiences, etc. We have not attempted to create a comprehensive catalogue of all the different types of models out there, but rather propose a framework for understanding how they relate to one another.
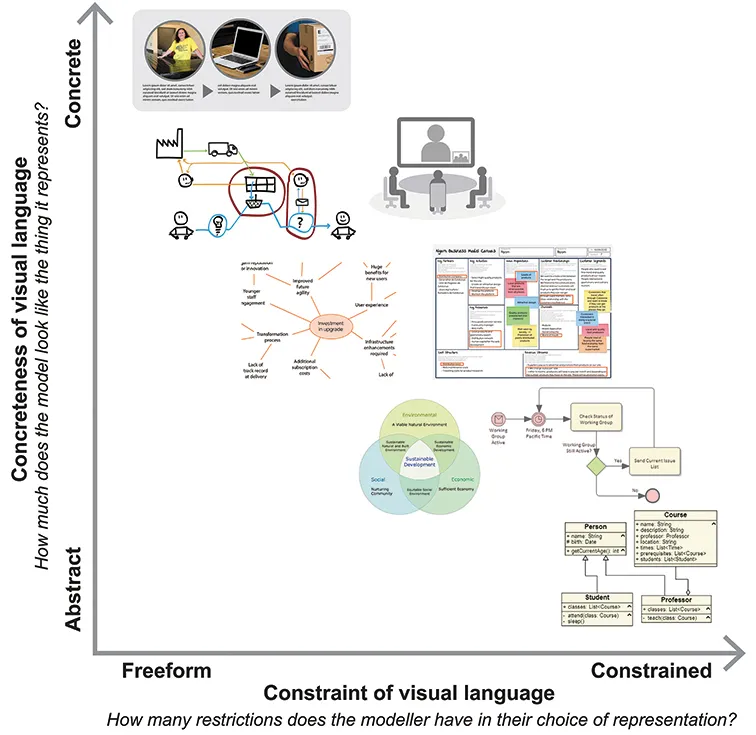
Our first proposition is that all of the visual modelling techniques used in business change can usefully be mapped according to their level of concreteness and constraint. The resulting graph produces what we will refer to as the ‘Visualisation Continuum’, which is the flow of models running from the top left to the bottom right. This is illustrated in Figure 1.1.
Figure 1.1 The Visualisation Continuum in outline
The horizontal axis of the graph addresses the degree of standardisation of the visual model – from freeform illustrations on the left (which give the modeller a great deal of discretion in how they represent things), through to highly constrained diagrams on the right (which use a formal, standardised notation). The vertical axis addresses the degree of concreteness – from highly abstract models at the bottom (which bear little visual resemblance to the things they represent), through to concrete models at the top (which clearly resemble their subject matter). The resulting Visualisation Continuum gives us a more meaningful way to compare the types of visualisations, the stakeholders that are associated with them and where they are produced in the change lifecycle. We discuss the Continuum in more detail in Chapter 2 and we refer to it throughout the book.
Our second proposition is that producers of models in transformation initiatives tend to be drawn towards one end of the Continuum or the other. The Continuum speaks to us of a cultural divide that seems to persist between two sets of communities; namely, those on the bottom right of the diagram who see the world more deterministically (typically programme and technical project managers, enterprise architects, business analysts, software developers) and those in the top left who tend to see the world more emergently (change managers, communicators, entrepreneurs, systems thinkers and designers). We will argue that the types of models associated with each community reflects its (often) unconscious assumptions and biases. Over time, the danger is that each community will come to ignore, denigrate or misrepresent the visual language of the other, resulting in models that generate fragmented rather than shared meaning.
Our third proposition is that finding new ways to model that close the gap between the two sets of communities and their associated approaches, methods and software tools, will increase organisational agility by improving shared meaning. We are not suggesting that the Visualisation Continuum needs to be somehow ‘shortened’, or that visual models need to somehow appeal to a lowest common denominator, but we are suggesting that a lot more could be done if there was more interchange between the two communities. The space on the top right quadrant of the Continuum diagram is conspicuously empty! We see an opportunity for new forms of visualisation that benefit from the rigour and constraints of standards-based approaches, but are more concrete in appearance so as to be more meaningful to more people.
This is all based on our underlying assumption that shared meaning between disparate stakeholder groups improves the efficiency and effectiveness of transformation; in other words, that it will create a better result for less time/effort/cost/risk. Our vision is that more meaningful model...