![]()
Section 1
The ECG in Prehospital Patient Care
![]()
Chapter 1
Clinical Applications of the Electrocardiogram (ECG)
Robert C. Schutt1, William J. Brady2, and Steven H. Mitchell3
1Department of Medicine, University of Virginia School of Medicine, Charlottesville, USA
2Departments of Emergency Medicine and Medicine, University of Virginia School of Medicine, Charlottesville, USA
3Emergency Services, Harborview Medical Center, University of Washington School of Medicine, Seattle, USA
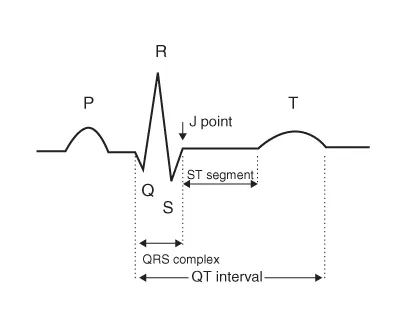
The electrocardiogram (ECG) has become a mainstay of medical care since Einthoven first introduced the concept of electrical imaging of the heart in 1903. He named the five electrical deflections of an “electrical heart beat” with the now well-known descriptors—P, Q, R, S, and T (Figure 1.1). Accurate interpretation of the ECG has become a necessary skill for every clinician who cares for acutely ill patients. The ECG is a non-invasive, inexpensive, easily performed test that allows a clinician to view the electrical activity in the heart. The ECG provides information not only about a patient's heart rhythm, but also about both cardiac (e.g., acute coronary syndrome [ACS] or myopericarditis) and non-cardiac conditions (e.g., electrolyte disorders, toxic ingestions, and pulmonary embolism).
Electrocardiogram Evaluation of Rhythm Disturbances
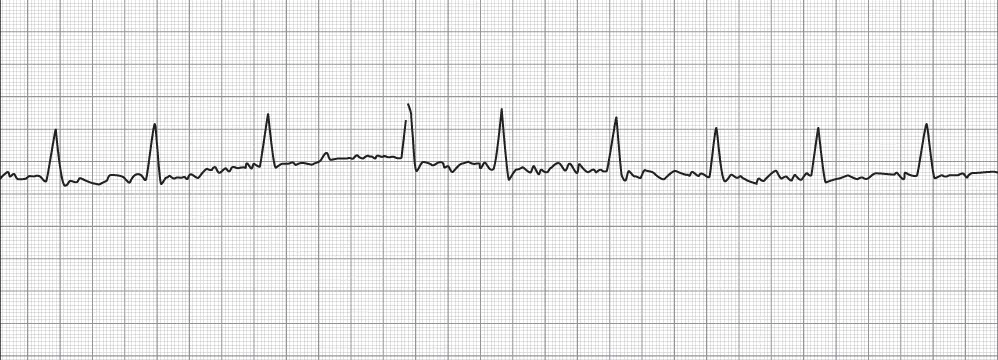
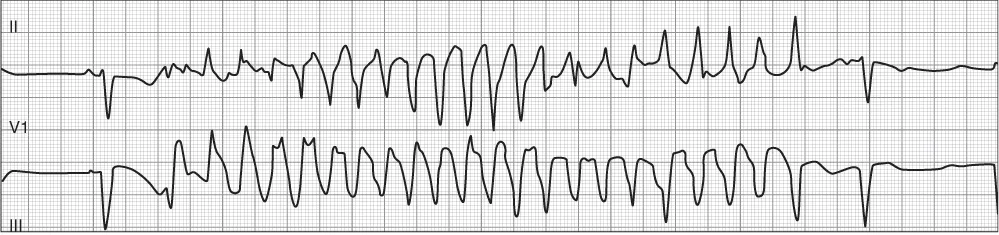
The rapid and accurate detection of ventricular fibrillation leading to sudden cardiac death has led to the development of prehospital emergency medical service (EMS) systems worldwide since the late 1960s. The use of ECG monitoring has grown from this early important step to become a mainstay of patient evaluation, not only for cardiac arrest but also for many other conditions. The ECG is the primary tool for evaluating the underlying rhythm of the heart. The ability to evaluate the heart rhythm is critical as cardiac dysrhythmias often are symptomatic and require immediate treatment. However, even if the dysrhythmia is not symptomatic, treatment may still be required to prevent future complications. Atrial fibrillation is a good example of a cardiac dysrhythmia easily identified on ECG, where symptoms may be completely absent or may be severe requiring immediate intervention. Depending on the rate (either fast or slow), the patient's symptoms may range from a benign fluttering in the chest to more serious symptoms of fatigue, chest pain, or syncope. Figure 1.2 is an example of atrial fibrillation with rapid ventricular response. A patient who experiences heart block may be symptom free or at risk for syncope or cardiac arrest with a high-degree atrioventricular (AV) block, as seen in Figure 1.3. Even when a patient is stable and without active symptoms, the ECG may provide clues that a patient is at risk for a potentially malignant rhythm. The patient depicted in Figure 1.4 is an example of long QT syndrome complicated by malignant ventricular dysrhythmia. The recognition of a prolonged QT interval is critical as patients with this electrocardiographic finding are at higher risk for dysrhythmia and sudden cardiac death (Figure 1.4).
One of the most important parts of prehospital medicine is the recognition and treatment of life-threatening dysrhythmias. For prehospital rhythm interpretation, the use of the ECG in a single- or multilead analysis mode is the most appropriate. For strict rhythm only analysis, the 12-lead ECG offers little additional information.
Electrocardiograhic Evaluation in the Setting of Acute Coronary Syndrome
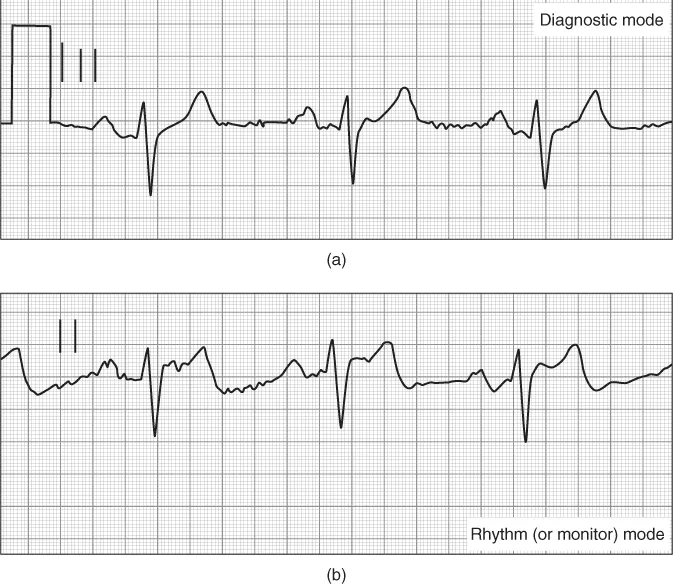
The ECG is also an important tool in evaluating the patient with a suspected ACS. The 12-lead ECG can not only provide important information regarding the ACS diagnosis but also guides therapy and predicts risk, and can suggest alternative diagnoses. The use of the 12-lead ECG in “diagnostic mode” is the most appropriate electrocardiographic tool; the use of single-lead rhythm monitoring is not of value with regard to ACS detection—yet single-lead monitoring is of extreme importance in the detection of cardiac rhythms, which can complicate ACS events (Figure 1.5).
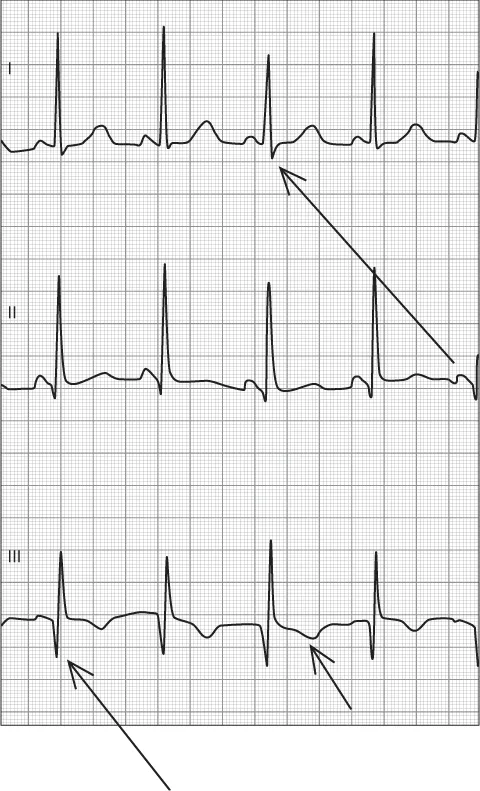
In patients with ST segment elevation myocardial infarction (STEMI), the ECG not only provides the specific diagnosis but is also the primary means for determining a patient's need for emergent reperfusion of the obstructed coronary artery; refer to Figure 1.6, which demonstrates an ECG of a patient with an inferior wall STEMI. It has been shown in numerous studies that the prehospital 12-lead ECG markedly reduces the time to hospital-based reperfusion (fibrinolysis and percutaneous coronary intervention) in patients with STEMI. In non-ST segment elevation myocardial infarction (NSTEMI) the ECG is also valuable. The ECG can display evidence of ongoing cardiac injury with T wave inversion or ST segment depression. The ECG can also help localize the obstructed coronary artery; for example, Wellens' Syndrome has a characteristic ECG pattern with changes to the T wave in the precordial leads, predominantly leads V2–V4, which can indicate a high-degree obstruction of the proximal left anterior descending coronary artery.
Electrocardiograhic Evaluation in the Setting of Non–Acute Coronary Syndrome Pathology
The ECG is also a useful tool in the evaluation of non-coronary artery pathology that manifests with changes to the ECG. Refer to Table 1.1 for a list of selected diseases not related to coronary obstruction that may have significant abnormalities evident on the ECG. Pericarditis (inflammation of the pericardial sac) leads to a diffuse pattern of PR segment depression and ST segment elevation that can be differentiated from STEMI as the elevation is present in a pattern not anatomically related to a coronary artery distribution. At the same time, the diagnosis of pericarditis can be difficult, and the patient may present with chest pain and ST segment elevation, potentially leading to the incorrect diagnosis of STEMI. Pericardial effusion with ultimate cardiac tamponade is caused by fluid in the pericardium that can accumulate owing to a variety of causes including recent viral infection or cancer. On the ECG, this condition leads to sinus tachycardia and low QRS complex voltage. Electrical alternans is also seen in this setting and is characterized by beat-to-beat alterations in the QRS complex size, reflecting the swinging motion of the heart in the pericardial fluid.
Table 1.1 Selected examples of non-coronary pathology evaluated by ECG
Pericarditis
- Diffuse non-anatomical ST segment elevation without reciprocal changes
- Diffuse PR segment depression
- Isolated ST segment depression and PR elevation in aVR
|
Pericardial tamponade
- Electrical alternans
- Low QRS complex voltage
- Diffuse PR segment depression
|
Hypothermia
- Osborn “J” waves
- Bradycardias and AV blocks
- Prolongation/widening of PR interval, QRS complex, and QT interval
- Atrial fibrillation with slow ventricular response
|
Hyperkalemia
- Diffuse non-anatomical peaked T waves
- Widening of PR interval and QRS complex widths
|
CNS events
- Diffuse, deep T wave inversions
- Minor ST segment elevations in leads with T wave inversions
|
Overdose and intoxication
- Rhythm disturbances
- Widened QRS complex
- Prolonged QT interval
|
There are also a host of conditions that are not primarily related to the heart where the ECG may provide a clue to diagnosis. Pulmonary embolism can present with the classic “S1Q3T3” on the ECG (Figure 1.7). Osborn waves are positive deflections occurring at the junction between the QRS complex and the ST segment that are typically observed in patients suffering from hypothermia with a temperature of less than 32°F. Several electrolyte disturbances exhibit characteristic changes to the ECG. Hyperkalemia first results in peaked T waves most apparent in the precordial leads. If the condition is untreated, however, the ECG may progress to widening of the QRS complex and the eventual fusing of the QRS complex and the T wave, resulting in a sine wave configuration and ultimately cardiac arrest. Central nervous system (CNS) events such as intraparenchymal hemorrhage, ischemic stroke, and mass lesion may also present with changes in the ECG, largely involving the T wave with inversion and prolongation of the QT interval.
![]()
Chapte...