The aim of this book is to provide an internationally respected collection of scientific research methods, technologies and applications in the area of data science. This book can prove useful to the researchers, professors, research students and practitioners as it reports novel research work on challenging topics in the area surrounding data science. In this book, some of the chapters are written in tutorial style concerning machine learning algorithms, data analysis, information design, infographics, relevant applications, etc. The book is structured as follows:
• Part I: Data Science: Theory, Concepts, and Algorithms
This part comprises five chapters on data Science theory, concepts, techniques and algorithms.
• Part II: Data Design and Analysis
This part comprises five chapters on data design and analysis.
• Part III: Applications and New Trends in Data Science
This part comprises four chapters on applications and new trends in data science.
1 Framework for Visualization of GeoSpatial Query Processing by Integrating MongoDB with Spark
S. Vasavi and P. Vamsi Krishna VR Siddhartha Engineering College
Anu A. Gokhale Illinois State University
CONTENTS
1.1 Introduction
1.1.1 Integration of Spark and MongoDB
1.2 Literature Survey
1.3 Proposed System
1.3.1 Methodology for Processing Spatial Queries
1.3.2 Spark Master-Slave Framework
1.3.3 Algorithms for Sharding
1.3.3.1 Algorithm for Range Sharding
1.3.3.2 Algorithms for Zone Sharding
1.3.4 Dataset and Statistics
1.4 Results and Performance Evaluation
1.5 Conclusion
References
1.1 INTRODUCTION
Companies that use big data for business challenges can gain advantages by integrating MongoDB with Spark. The Spark framework provides support for analytics, where process execution is fast because of in-memory optimization. Out of various NoSQL databases, MongoDB provides a document data model that suits to variety and voluminous amounts of data. As such, when integrated, MongoDB and Spark together can index data efficiently and help in analytics of data-driven applications. Geospatial data can be analyzed to serve the needs of various applications such as tourism, healthcare, geomarketing, and intelligent transportation systems. Spatial data occurs in two forms: vector and raster that store latitude and longitude of objects. Keyhole markup language (KML) is a tag-based structure and can be used to display geographic data.
Tableau uses various file formats such as KML, ERSI shape files, GeoJSON (JavaScript Object Notation) files, and MapInfo Interchange formats for geographic data analysis, and display. Traditional databases process on structured data that guarantees ACID (Atomicity, Consistency, Isolation, and Durability) properties. NoSQL databases are developed to store and process unstructured data that guarantees CAP (Consistency, Availability and Partition Tolerance) properties with less response time. MongoDB has no query language support, but data can be indexed as in relational databases, structured as JSON fragments and can process social networking applications, where latency has to be optimized. Cassandra monitors nodes, handles redundancy, and avoids lazy nodes, whereas MongoDB monitors these activities at a higher granular level. Even though some works are reported for labeling and retrieving data from MongoDB, they are inefficient either at indexing or at retrieval. This chapter aims at adding the functionality of spatial querying for MongoDB database by integrating it with Spark.
Every location on this globe is a representation of intersection of latitude and longitude coordinates. Spatial operations are classified by the authors of [1]: proximity analysis queries such as “Which parcels are within 100 meters of the subway?,” contiguity analysis queries such as “Which states share a border with Coorg?,” and neighborhood analysis queries such as “Calculate an output value at a location from the values at nearby locations?” Geohashing techniques are used to find the nearest location of a specified source location with high precision values. Latitude and longitude are used to calculate geohash value: the higher the precision value, the more the length of geohash value. Instead of sequential processing of the database, a parallel search process must be done for a required destination using this geohash. To achieve this, MongoDB is integrated with Spark, which is an efficient distributed parallel processing.
1.1.1 INTEGRATION OF SPARK AND MONGODB
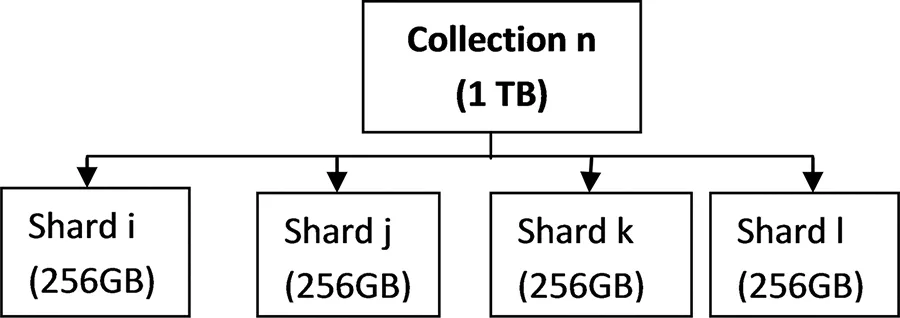
Spark is a distributed system for processing variety of data, and MongoDB aims for high availability. By combining both Spark and MongoDB, spatial operations on geospatial data can be processed effectively [2]. The MongoDB Connector to Hadoop and Spark provides read/write data to MongoDB using Scala. When client submits a geospatial query, the master node initially chooses an executor. This executor selects sharding based on the shard key. This shard key is used to store and retrieve similar keys from the in-memory document collection with high precision and optimized processing time. Sharding techniques (horizontal scaling) distribute geospatial data into various nodes [3]. Figure 1.1 presents sharding at collection level.
A MongoDB shard cluster consists of shard, mongos, and config servers. Mongos acts as an interface where the application layer determines a particular sharded cluster for geospatial data. Hashed sharding computes a hash value for each of the shard keys. Based on this, each chunk is assigned a range. Ranged sharding divides data into ranges based on shard key values, and then each chunk is assigned a range [4].
FIGURE 1.1 Sharding at collection level.
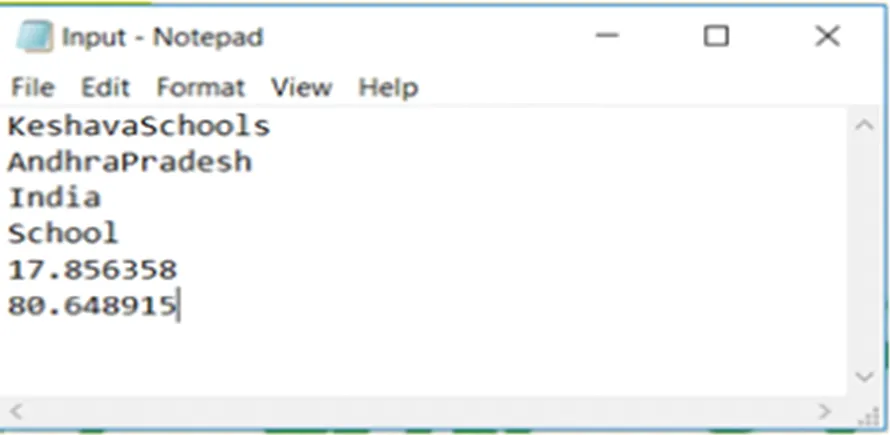
The following paragraph presents how Range (Tag) Sharding and Zone Sharding compute the hash values. Figure 1.2 presents a sample geospatial input.
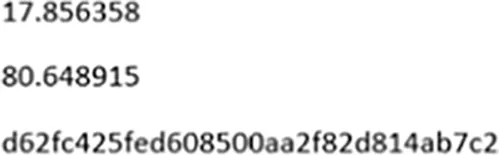
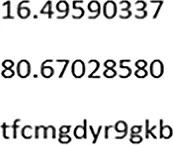
Figure 1.3 presents Geohash computed using MD5 algorithm that guarantees uniform distribution of writes across shards but is less optimal for range-based queries.
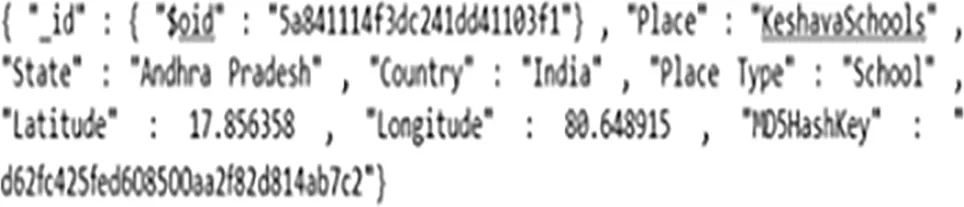
Figure 1.4 presents document after appending HashKey. Similar process is followed in both storage and retrieval operations for finding the corresponding shard.
The calculated MD5 value is the shard key and is appended to the document as shown in Figure 1.5.
FIGURE 1.4 Hashed sharding: appending the HashKey and storing in the database.
FIGURE 1.5 Data representation in hashed sharding.
The following Figure 1.6 presents the shard key value for range sharding.
Figure 1.7 presents document after appending shard key. Similar process is followed in both storage and retrieval operations for finding the corresponding shard.
The calculated shard value is the shard key and is appended to the document based on the latitude and longitude ranges as shown in Figure 1.8.
Figure 1.9 presents the shard key value for zone sharding.
FIGURE 1.6 Range sharding: generating shard key.
FIGURE 1.7 Range sharding: appending the shard key and storing in the database.
FIGURE 1.8 Data representation in range sharding.
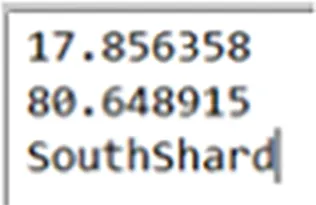
FIGURE 1.9 Zone sharding: generating shard zone based on geographic region.
Figure 1.10 presents document after appending the Shard Zone. Similar process is followed in both storage and retrieval operations for finding the corresponding shard. When this shard key range is modified, data is migrated to a new zone automatically.
The calculated geohash value is the shard key and is appended to the document based on the zone of input location along with the zone value, as shown in Figure 1.11.
LTRMP (Long Term Resourc...
Table of contents
Cover
Half Title
Title Page
Copyright Page
Dedication Page
Table of Contents
Preface
Editors
Contributors
Part I Data Science: Theory, Concepts, and Algorithms
Part II Data Design and Analysis
Part III Applications and New Trends in Data Science
Index
Frequently asked questions
Yes, you can cancel anytime from the Subscription tab in your account settings on the Perlego website. Your subscription will stay active until the end of your current billing period. Learn how to cancel your subscription
No, books cannot be downloaded as external files, such as PDFs, for use outside of Perlego. However, you can download books within the Perlego app for offline reading on mobile or tablet. Learn how to download books offline
Perlego offers two plans: Essential and Complete
Essential is ideal for learners and professionals who enjoy exploring a wide range of subjects. Access the Essential Library with 800,000+ trusted titles and best-sellers across business, personal growth, and the humanities. Includes unlimited reading time and Standard Read Aloud voice.
Complete: Perfect for advanced learners and researchers needing full, unrestricted access. Unlock 1.4M+ books across hundreds of subjects, including academic and specialized titles. The Complete Plan also includes advanced features like Premium Read Aloud and Research Assistant.
Both plans are available with monthly, semester, or annual billing cycles.
We are an online textbook subscription service, where you can get access to an entire online library for less than the price of a single book per month. With over 1 million books across 990+ topics, we’ve got you covered! Learn about our mission
Look out for the read-aloud symbol on your next book to see if you can listen to it. The read-aloud tool reads text aloud for you, highlighting the text as it is being read. You can pause it, speed it up and slow it down. Learn more about Read Aloud
Yes! You can use the Perlego app on both iOS and Android devices to read anytime, anywhere — even offline. Perfect for commutes or when you’re on the go. Please note we cannot support devices running on iOS 13 and Android 7 or earlier. Learn more about using the app
Yes, you can access Data Science by Qurban A Memon,Shakeel Ahmed Khoja in PDF and/or ePUB format, as well as other popular books in Computer Science & Computer Science General. We have over one million books available in our catalogue for you to explore.