In recent years, there has been an increased interest in assessing the UK offshore wind resource as offshore wind farms have started to be planned and developed. The optimal way of assessing a site is by erecting a mast and making measurements at several heights over a period of greater than a year. The drawback of this approach is the high cost of masts capable of making measurements over the extent of a wind turbine rotor. In addition, such masts can only make measurements at one geographical location. In order to help address the second point, a study has been made of the spatial variation in long-term wind resource for the UK Round 3 offshore wind farm sites using a popular reanalysis dataset, namely ERA–40. The characteristics of the wind resource are assessed to give an insight into the wind conditions likely to be experienced at future Round 3 wind farm sites.
The ERA–40 database: background
Reanalysis data are a source of meteorological information derived from numerical weather prediction (NWP) models initialised using historical weather observations from satellites, aircraft, balloons, and surface stations. The NWP model generates time series, which can cover several decades, of gridded atmospheric variables containing among others: temperature, pressure, wind, humidity and precipitation.
In particular, ERA–40 is a second generation reanalysis of the global atmospheric data over a 45-year period from 1st September 1957 to 31st August 2002 (Uppala 2005). It was created from an ECMWF Integrated Forecast Model and it was the first reanalysis to directly assimilate satellite radiance data as well as the Cloud Motion Winds from 1979 onwards. The model has 60 vertical levels with a spectral resolution of around 125 km (T159) and observations recorded every 6-hours through a 3D variational analysis.
This section covers research undertaken using 21 years of this dataset, corresponding to the data from 1st January 1968 to 31st December 1989. The wind data were available in the form a geographical grid with a horizontal resolution of 1o × 1o every 6 hours at 10 metres height.
In this section, the wind conditions are summarised at locations representative of the original nine UK Round 3 Offshore Wind Farm development sites. The summary statistics presented are designed to give an idea of the variation in wind speed and wind speed distribution at the sites as a function of direction, season, and time of day. The data analysed are 10 m values so would need to be extrapolated to wind turbine hub height for energy yield analysis.
Wind direction
This section looks at the behaviour of the frequency distribution of the wind for the Round 3 sites. First, the results are presented using wind roses and then in order to look at temporal variation in the wind direction, data are presented as frequency plots.
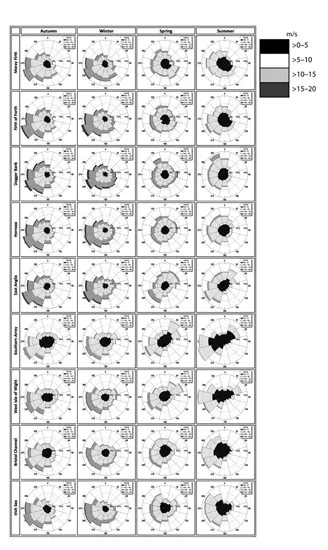
The wind roses are presented in Figure 1.2 showing the directional pattern for each interpolated Round 3 site over the whole period and by season (Winter = DJF, Spring = MAM, Summer = JJA, Autumn = SON). Each direction of the wind rose has superimposed the distribution of wind speed in bins of 5 m/s.
It can be seen from examination of these wind roses that the sites show a broadly similar behaviour with a predominance of winds from the south through to west sectors. However, those sites relatively close to the south coast, i.e. West Isle of Wight and Southern Array, show slightly different behaviour with evidence of channelling along the south-west to north-east axis. This would seem to be consistent with the location of the land masses of the south-coast of England, the Isle of Wight and the northern French coast with the effect of the English Channel noticeable.
The wind roses also show some differences by season. Aside from the obvious differences in mean wind speed (highest in winter and lowest in summer), some
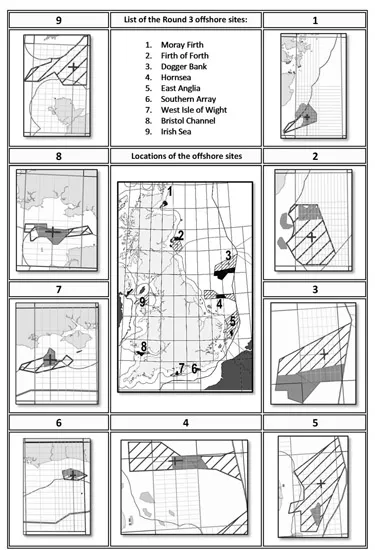
Table 1.1 Coordinates (in degrees) for the interpolated centre of each Round 3 site (tIP) and the four surrounding coordinates from the ERA–40 reanalysis database (t1, t2, t3, t4)
Figure 1.1 UK map with the geographical location of the Round 3 sites
The interpolation point of each Round 3 site is also shown.
Figure 1.2 Wind roses over the whole study period and by season for each Round 3 site
of the sites show significant differences in the sectors from which the wind blows most frequently. East Anglia, Southern Array and West Isle of Wight show a tendency to an increase in north-easterly winds during the spring and summer months. Dogger Bank and to some extent Hornsea see an increase in northerly winds during the spring and summer. For Bristol Channel and the Irish Sea site, shelter due to the land reduces variability though there is a slight tendency for more north-westerly winds. The far northerly Scottish sites of Moray Firth and the Firth of Forth show the least variation in direction.
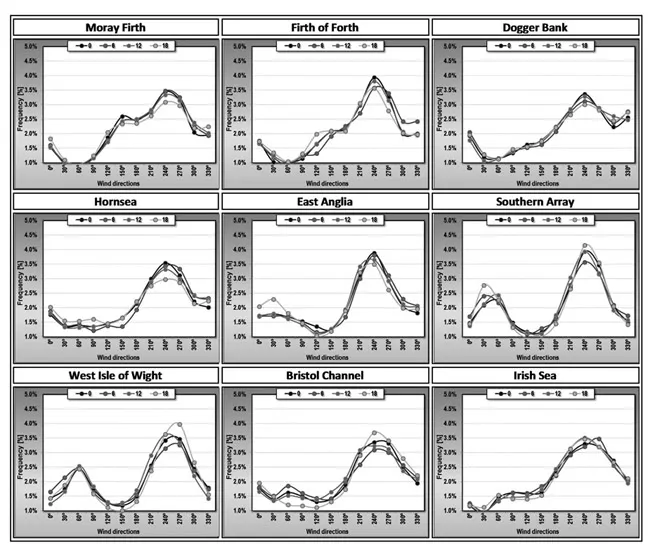
The diurnal behaviour of the wind direction is shown in Figure 1.3. This time, the data are presented as a frequency distribution to enable an easier comparison of the wind distribution inferred from the six-hourly reanalysis data.
Figure 1.3 Directional frequency distributions for each Round 3 site by time of day
The legend gives the time of day in the form: 0 = 00Z, 6 = 06Z, 12 = 12Z, 18 = 18Z.
It can be seen that although there is some variation in wind rose with time of day, this variation is not large across the sites. The Bristol Channel site shows some evidence for a funnelling of the wind along the Severn Estuary during the later afternoon driven by a sea breeze. East Anglia shows a tendency to more north-north-easterly winds in the later afternoon which is probably due to a sea-breeze effect. Southern Array shows a tendency to stronger channelling along the north-east to south-west axis during later afternoon indicating a combination of orographic channelling and a sea breeze. Dogger Bank shows virtually no variation which might be expected as it is furthest from land. Interestingly, Hornsea shows some variation despite also being one of the furthest offshore sites. The Irish Sea site and the Scottish sites show no strong influence due to the UK or Irish land masses.
Wind speed
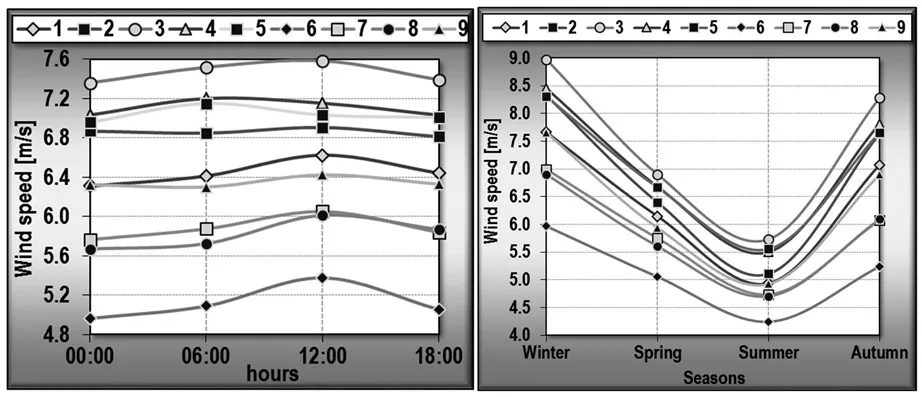
Figure 1.4 shows the variation in 10 m wind diurnally and seasonally for the Round 3 sites. Diurnal variation is relatively small and all sites display a peak daily wind speed around midday with the exception of Hornsea and East Anglia where the peak is in the evening. All sites show significant seasonal variation with highest winds in winter and lowest in summer as noted previously.
Figure 1.4 Diurnal (left) and seasonal (right) variation in the 10 m mean wind speed for the Round 3 sites
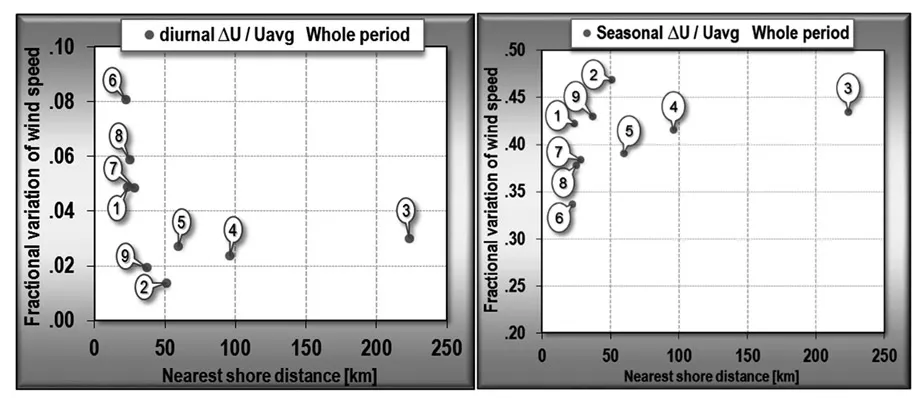
Figure 1.5 (a) Diurnal and (b) seasonal variation as a fraction of average wind speed for each of the Round 3 sites
Figure 1.5(a) shows the average fractional variation in daily wind speeds for the Round 3 sites as a function of distance from the coast. It can be seen that there is a strong dependence on proximity to the land as might be expected, with variation up to 8 per cent for the closest site. Beyond around 30 km, there is little change in diurnal variation which tends to around 1–3 per cent. ...