This volume of the Biostatistics and Health Sciences Set focuses on statistics applied to clinical research. The use of Stata for data management and statistical modeling is illustrated using various examples. Many aspects of data processing and statistical analysis of cross-sectional and experimental medical data are covered, including regression models commonly found in medical statistics. This practical book is primarily intended for health researchers with basic knowledge of statistical methodology. Assuming basic concepts, the authors focus on the practice of biostatistical methods essential to clinical research, epidemiology and analysis of biomedical data (including comparison of two groups, analysis of categorical data, ANOVA, linear and logistic regression, and survival analysis). The use of examples from clinical trials and epideomological studies provide the basis for a series of practical exercises, which provide instruction and familiarize the reader with essential Stata packages and commands.
- Provides detailed examples of the use of Stata for common biostatistical tasks in medical research
- Features a work program structured around the four previous chapters and a series of practical exercises with commented corrections
- Includes an appendix to help the reader familiarize themselves with additional packages and commands
- Focuses on the practice of biostatistical methods that are essential to clinical research, epidemiology, and analysis of biomedical data
Trusted by 375,005 students
Access to over 1.5 million titles for a fair monthly price.
In this chapter, the main topic will be the mode of representation of data in Stata and their manipulation. In particular, we will see how to represent numerical variables and categorical variables, how to operate on subsets of observations or how to only select parts that verify logical conditions, and finally the base syntax of Stata instructions (if, in, by).
Keywords
Categorical variable; Data management; Data representation; Language elements; Missing values; Numerical variable; Qualitative variables; Stata language; Variable management
In this chapter, the main topic will be the mode of representation of data in Stata and their manipulation. In particular, we will see how to represent numerical variables and categorical variables, how to operate on subsets of observations or how to only select parts that verify logical conditions, and finally the base syntax of Stata instructions (if, in, by).
1.1 Data representation in Stata
The data manipulated in Stata are mainly of two types: numbers and character strings. The numbers can be integers or real numbers. The first type is also used to encode the levels of a categorical variable to which text labels can be associated, called “variable labels” in Stata.
1.1.1 The Stata language
There are controls that allow users to easily generate a series of random numbers. The following example helps to familiarize with the basic elements of the Stata language. The following series of instructions allows storing in a variable called x 10 observations obtained from a normal distribution of average 12 and standard deviation 2:
. set obs 10
. generate x = rnormal(12, 2)
. format x %6.3f
. summarize x, format
obs was 0, now 10
Several remarkable features of the language should be noted: it is necessary to indicate the size of the sample used. In the following sections, we will see how these data can be obtained during manual input or when importing an external data file. The command generate can be used to associate with a variable, here x, a sequence of numeric values (assimilated here to our 10 observations) provided by the function (or subcommand) rnormal(). This latter has options available which enables the user to specify parameters of the distribution (mean and standard deviation, respectively) be specified. The command format x makes it possible to limit the display to 3 decimal places: this is a property of representation of the values of x directly associated with the variable that the command summarize can use.
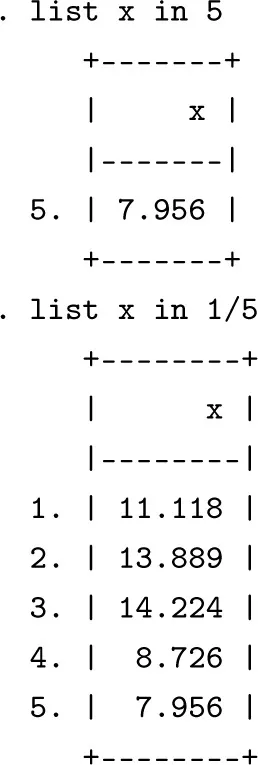
Individual data can be examined by means of the command list. For example, the command list x will display all of the values of x. Since there is only a single variable present in the Stata workspace, it is nonetheless equivalent to typing list for short. The option in can be included to restrict the display of the values of x to the fifth observation or to the first five observations. In the latter case, the ranks of the observations are indicated in the first value/last value form: the expression 1/5 therefore designates the observations numbered 1–5:
1.1.2 Creating and manipulating variables
In the case of small datasets, it is possible for users to enter themselves the observations, although most of the time it will be preferable to work from an external file. For this purpose, the command input is available which is employed in the following manner: after the name of the command, the name of the variable(s) is indicated, separated by a space, and then the user ought to press the Enter key before entering the data, always separated by spaces. To indicate to Stata that the entry is complete, the word end must be inserted. This manual entry can also be performed from the data editor (Data
Data Editor
Data Editor (Edit)). Here is an example of the usage with a series of 10 weight measuremen...
Table of contents
Cover image
Title page
Table of Contents
Copyright
Introduction
1: Language Elements
2: Measures of Association, Comparisons of Means and Proportions for Two Samples or More
3: Linear Regression
4: Logistic Regression and Epidemiological Analyses
5: Survival Data Analysis
Bibliography
Index
Frequently asked questions
Yes, you can cancel anytime from the Subscription tab in your account settings on the Perlego website. Your subscription will stay active until the end of your current billing period. Learn how to cancel your subscription
No, books cannot be downloaded as external files, such as PDFs, for use outside of Perlego. However, you can download books within the Perlego app for offline reading on mobile or tablet. Learn how to download books offline
We are an online textbook subscription service, where you can get access to an entire online library for less than the price of a single book per month. With over 1.5 million books across 990+ topics, we’ve got you covered! Learn about our mission
Look out for the read-aloud symbol on your next book to see if you can listen to it. The read-aloud tool reads text aloud for you, highlighting the text as it is being read. You can pause it, speed it up and slow it down. Learn more about Read Aloud
Yes! You can use the Perlego app on both iOS and Android devices to read anytime, anywhere — even offline. Perfect for commutes or when you’re on the go. Please note we cannot support devices running on iOS 13 and Android 7 or earlier. Learn more about using the app
Yes, you can access Biostatistics and Computer-based Analysis of Health Data using Stata by Christophe Lalanne,Mounir Mesbah in PDF and/or ePUB format, as well as other popular books in Computer Science & Business Intelligence. We have over 1.5 million books available in our catalogue for you to explore.