The Open Access version of this book, available at http://www.taylorfrancis.com/books/e/9780429285912, has been made available under a Creative Commons Attribution-Non Commercial-No Derivatives 4.0 license.
This innovative book addresses the question of why increasing numbers of people are being diagnosed with autism since the 1990s. Providing an engaging account of competing and widely debated explanations, it investigates how these have led to differing interpretations of the same data. Crucially, the author argues that the increased use of autism diagnosis is due to medicalisation across the life course, whilst holding open the possibility that the rise may also be partly accounted for by modern-day environmental exposures, again, across the life course.
A further focus of the book is not on whether autism itself is valid as a diagnostic category, but whether and how it is useful as a diagnostic category, and how the utility of the diagnosis has contributed to the rise. This serves to move beyond the question of whether diagnoses are 'real' or social constructions, and instead asks: who do diagnoses serve to benefit, and at what cost do they come?
The book will appeal to clinicians and health professionals, as well as medical researchers, who are interested in a review of the data which demonstrates the rising use of autism as a diagnosis, and an analysis of the reasons why this has occurred. Providing theory through which to interpret the expanding application of the diagnosis and the broadening of autism as a concept, it will also be of interest to scholars and students of sociology, philosophy, psychiatry, psychology, social work, disability studies and childhood studies.
Trusted by 375,005 students
Access to over 1.5 million titles for a fair monthly price.
My academic research has involved analysing data, both quantitative (numbers) and qualitative (texts or conversations). In epidemiological studies, I have examined the numbers of children with autism diagnoses and their change over time.1,2 Many other researchers have covered similar ground, measuring autism in different ways, sometimes using a research diagnosis, sometimes clinical reports or parental reports of diagnosis.3–8 The graphs in this chapter show some of the published data on autism time trends in Europe and the USA. To establish the trends, I have used multiple datasets from many sources. Rather than reading as monotonous, I hope this will harness the power of repetition.
Prevalence is the number of people in a population who have a condition, relative to the total population, typically shown as a percentage. Each data point in Figure 1.1–1.5 represent the estimated percentage of children who had autism at that time. Figure 1.1 shows the time trend in prevalence estimates from the 1970s into the 2000s; the earlier data (up to 2011) originate from an article in Nature (‘The prevalence puzzle’9) and the later data from the Centers for Disease Control and Prevention (CDC) in the USA.10
Figure 1.1Post-1970 time trend in estimated prevalence of autism.
The earliest estimates hark back to the first epidemiological studies of autism that were carried out in the UK by Victor Lotter and his team in 196611 and in the USA by Darold Treffert, published four years later.12 Lotter estimated about one in 2,500 children had autism and the first study by Treffert estimated that fewer than one child in every 10,000 had autism. At that time, autism was considered an extremely rare condition and was almost always associated with intellectual disability.
Figure 1.1 gives an overall, and quite compelling, impression of an exponential increase in the use of the label of autism. But it is debatable how directly comparable the early data in Figure 1.1 are with the later data, as studies use different methods to establish exactly who has autism, as well as having a wide geographic spread.
To get over some the limitations of Figure 1.1’s geographical and methodological disjointedness, it is worth looking at other datasets. The data in Figure 1.2, which are publicly available, were all taken from CDC data. Since 2000, this American centre has repeatedly used the same methods to measure how many children (from an enormous sample of more than 300,000) have autism.10 The data, of children of eight years old, are recorded in 11 sites around the USA, a process repeated every few years. In this huge study, researchers obtain children’s evaluation records from data sources in the community. Experienced clinicians review these records to determine whether the behaviours described are consistent with the diagnostic criteria for autism. Children with a documented autism diagnosis are also included in their case definition. The period it covers, 2000–2012, therefore uses comparable methodology and sampling methods to create the time trend and so gets round some of the problems of compatibility. Because methods of case ascertainment remained more or less stable, the numbers through time are more directly equivalent. Figure 1.2 illustrates how the estimated prevalence of autism has risen year on year. In 2014, there was a 15% increase from two years before (2012), when 1.7% of children reportedly had autism, and a 150% increase since 2000. The last estimate, reported in 2014, included in Figure 1.2, is that by the age of eight 1.68% of children have autism, which translates to one in every 59 children. The linear time trend provides the best fit, according to some post hoc work done by our PhD student, Rhianna White.
Figure 1.2Twenty-first-century time trend from prevalence estimates.
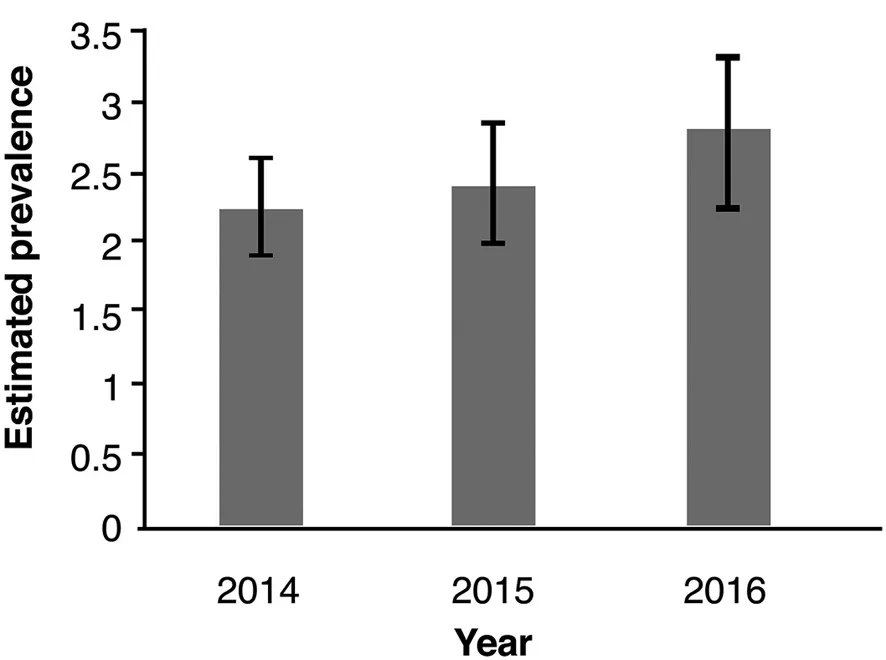
Another dataset, plotted in Figure 1.3, is taken from the US National Health Interview Survey (NHIS). These results were published in 2018 in a letter in the Journal of the American Medical Association (JAMA) and estimated the prevalence of autism in 2016 at 2.7%.13 Unlike the CDC study, this is a nationally representative sample, meaning one in every 37 American children is reported to have identified autism in 2016. The estimates from the NHIS are obtained in telephone interviews with parents of children and adolescents. The latest sample comprised around 30,000 parents of children between the ages of three and 17. They were asked: ‘has a doctor or health professional ever told you that [your child] has autism, Asperger’s disorder, pervasive developmental disorder or autism spectrum disorder?’ These are all conditions on the autism spectrum – forms of autism as we know it today.
Figure 1.3National Health Interview Survey data.
The NHIS data also have their limitations. Arguably, the question’s phrasing has led to an over-estimate of the number of children identified as having a diagnosis of autism. Parents could interpret ‘health professional’ to mean a number of professionals, for example a school psychologist who may have mentioned autism as a possibility, without it being confirmed. Nevertheless, using the same question in consecutive years, the estimates show a consistent, although not statistically significant, rise. The overlapping confidence intervals shown in Figure 1.3, indicating non-significance, are not surprising, given the short, two-year, timeframe under study. Despite this, the work was framed in the press as evidence that autism was stable, a somewhat dubious interpretation; from the observed data, it would more accurately be described as a non-significant rise.
This draws our attention to language and interpretation. In an article reporting the reducing chances of autism for children receiving the measles, mumps and rubella (MMR) vaccine, such an effect is described as ‘a non-significant decrease’.14 There is no link between MMR and autism; this is well established. The point is rather that how the data are interpreted and language used to describe effects seems to be shaped by the body politic: whether the interpretation fits the acceptable scientific narrative. This is a theme I will return to.
A fourth set of data (Figures 1.4 and 1.5) harks from a global systematic review of autism prevalence published in 2012 by Mayada Elsabbagh and colleagues. They drew on more than 25 epidemiological studies that estimated autism prevalence in different locations around the world,15 using a variety of methods to identify autism cases. The authors published prevalence estimates from 11 European countries as well as US estimates (Figure 1.4 shows their European and Figure 1.5 their US data). The European data from this systematic review show steadily rising estimates from the 1960s to 2010. The US data cover the trend over 40 years and again show a steady increase. Exponential increases are significant in both the European and American datasets but the shallow best-fit line for the European data suggests the trend was less marked than in the USA during the early 2000s, and in both there was wide variation by region. The authors conclude that their review provides clear evidence of increasing estimates over time in both continents. The exponential trend is significant in both datasets but not as good a fit to the data as other figures seen here.
Figure 1.4Prevalence estimates of autism in European countries.
Figure 1.5Prevalence estimates in the USA.
These data suffer from the same limitations as the data in Figure 1.1, in that data points on the graphs use different methods of case ascertainment and each is from a different place. In Europe, in particular, there is wide variation in geography, culture and the methods used to ascertain autism. On the other hand, these data are valuable because they draw on many studies which were sampled in a systematic, and therefore replicable, way.
This brief review provides pretty compelling evidence for the rise of autism internationally, although the data are somewhat dated, as there is a time lag between gathering and publication. I am writing from the UK, so what of the UK situation?
We examined the increase in incidence of autism diagnosis as recorded by family doctors, known as general practitioners (GPs) in England.1 GPs report on their patients using diagnostic codes, providing an enormous population-based sample of more than nine million people. We examined incidence – in other words, new recordings – of cases of autism (Figure 1.6 shows the best fit line of the index number: that is, starting at 100% in 1998, which was the baseline year, and plotting the increase in percentage relative to 100% at each year. So 120% represents 20% increase in recorded cases). Again, we found the exponential trend was the best fit to describe the time trend over a 20-year period – an exponential trend in new cases, not a cumulative prevalence estimate which would have shown an even steeper trend. Year on year there have been more new cases of autism recorded than in the previous year, over the 20-year timeframe. Granted, the GP dataset is not ideal for studying autism, as autism diagnoses are mostly made in secondary care diagnostic assessment services, which accept school, public health nursing and sometimes self- or parent-referrals, as well as referrals by GPs. This means diagnoses may not always be sent back to GPs from secondary care. Additionally, some GPs are better at recording than others and their diligence may have increased with time. The fig...
Table of contents
Cover
Half Title
Series Information
Title Page
Copyright Page
Dedication
Contents
List of illustrations
Acknowledgements
Introduction
1 Establishing the trend
Part I ‘Artefactual’
Part II ‘Real’
Index
Frequently asked questions
Yes, you can cancel anytime from the Subscription tab in your account settings on the Perlego website. Your subscription will stay active until the end of your current billing period. Learn how to cancel your subscription
No, books cannot be downloaded as external files, such as PDFs, for use outside of Perlego. However, you can download books within the Perlego app for offline reading on mobile or tablet. Learn how to download books offline
Perlego offers two plans: Essential and Complete
Essential is ideal for learners and professionals who enjoy exploring a wide range of subjects. Access the Essential Library with 800,000+ trusted titles and best-sellers across business, personal growth, and the humanities. Includes unlimited reading time and Standard Read Aloud voice.
Complete: Perfect for advanced learners and researchers needing full, unrestricted access. Unlock 1.5M+ books across hundreds of subjects, including academic and specialized titles. The Complete Plan also includes advanced features like Premium Read Aloud and Research Assistant.
Both plans are available with monthly, semester, or annual billing cycles.
We are an online textbook subscription service, where you can get access to an entire online library for less than the price of a single book per month. With over 1.5 million books across 990+ topics, we’ve got you covered! Learn about our mission
Look out for the read-aloud symbol on your next book to see if you can listen to it. The read-aloud tool reads text aloud for you, highlighting the text as it is being read. You can pause it, speed it up and slow it down. Learn more about Read Aloud
Yes! You can use the Perlego app on both iOS and Android devices to read anytime, anywhere — even offline. Perfect for commutes or when you’re on the go. Please note we cannot support devices running on iOS 13 and Android 7 or earlier. Learn more about using the app
Yes, you can access The Rise of Autism by Ginny Russell in PDF and/or ePUB format, as well as other popular books in Medicine & Medical Theory, Practice & Reference. We have over 1.5 million books available in our catalogue for you to explore.