![]()
Part I
The Context for Economic Analysis
![]()
Chapter 0
Macroeconomics and Well-Being
What comes to your mind when you think of the word “economics”? Perhaps you think about things like inflation, unemployment, GDP (gross domestic product), supply and demand, and money. These things are definitely important in our study of economics, and we will spend much of our time in this book studying these concepts.
But the goals of economics are about much more than these. As we will see in Chapter 1, economics is the study of how people manage their resources to meet their needs and enhance their well-being. The term “well-being” can mean different things to different people. Traditional macroeconomic indicators like inflation, money, investment, and unemployment clearly affect our well-being. But so does our health, the quality of our environment, our leisure time, our perceptions of fairness and justice, and many other factors. In this book, we will take an inclusive approach to well-being.
If the goal of economics is to enhance our well-being, then it helps to have an idea about our current level of well-being—where we are doing well and where some improvement is desired. In this chapter, we introduce some of the most relevant data on macroeconomic indicators and well-being. Since in this book we are studying macroeconomics (as opposed to microeconomics), we are often concerned with various measures at a national level. This chapter provides you with an overview of how a variety of countries compare across different measures of macroeconomic performance and well-being. As this book is aimed at European students, a specific focus here and in much of the rest of the book is put on the European Union, the euro area, and some of its most important member states (including Great Britain, which is still included in all official statistics on the European Union even though its government has made clear that it is going to leave the EU following a referendum on this question in June 2016). However, we recognize the importance of understanding any country within the global context. For each topic illustrated in this chapter, we present data on the European Union and some of its member states relative to other countries in order to provide some international perspective on the performance of the European economies. Different from later chapters in which we look at details of GDP (where we will mostly look at the euro area), we focus in this chapter mainly on the whole European Union with its 28 members (including the UK). The reason is that for some of the indicators, data for the EU is available, but not for the euro area. In contrast, when it comes to the details of GDP, it makes more sense to look at the euro area specifically which in many respects resembles a national economy. If you are interested in the performance of specific countries we have not included here, we provide detailed tables on the book’s companion Web site: www.gdae.org/europeanmacro/.
The topics covered here preview many of the issues that are covered in more detail in later chapters. You may find some of the information in this chapter surprising. Sometimes the data-based results differ from common perceptions and media representations. But we have tried to be as objective as possible by presenting a wide range of data from reliable sources. Good data is essential for informed debates about how to enhance well-being in our communities, our country, and our planet.
Notes on Graphs
For each measure we include in this chapter, we provide a bar graph showing the data for selected countries. (Again, tables presenting the available results for all countries can be found on the book’s Web site at www.gdae.org/europeanmacro/.) The countries shown here have been chosen to convey the full range of results, with a focus on the European Union and some of its member states (the EU results are presented in a different color). Major countries, such as the U.S., China, and India, are also included in each figure. Country rankings are provided, based on the available data, including the highest and lowest values for each variable. While there are more than 200 countries in the world, data is not available for all countries for each variable. Thus the number of countries ranked for each variable differs. For example, in our first chart (GDP per capita), we show that the lowest ranking for a country is 186. This tells you that reliable, accessible data on this variable is available for 186 of the countries in the world.
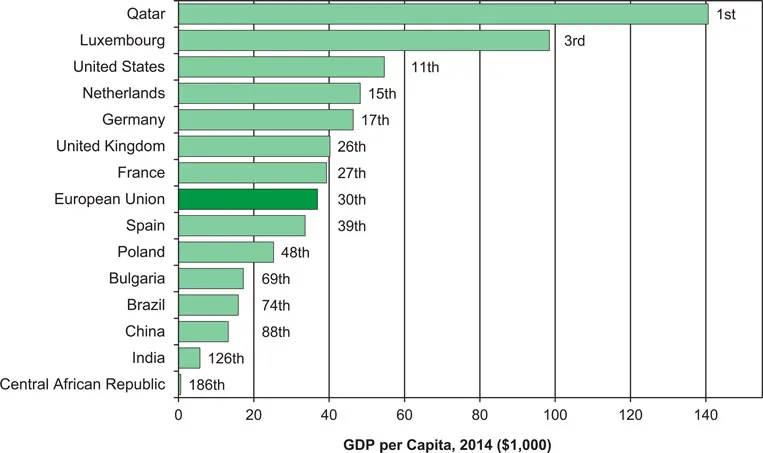
For each graph, the names of the countries selected appear on the left. The bar to the right of the country’s name shows the value for that country, reading down from the end of the bar to the horizontal axis. Comparative data on GDP is presented in U.S. dollars, as most international data sources use the dollar rather than the euro as the main currency for cross-country comparisons. For example, we can see in the first graph that GDP per capita is roughly $16,000 in Brazil, a little under $37,000 in the EU, and almost $100,000 in Norway. If you want to find out the precise values, those are given on the book’s Web site. Finally, to the right of each bar is that country’s ranking for that variable. So Luxembourg has the third-highest GDP per capita, the United States the eleventh-highest, and Brazil the seventy-fourth-highest. Among the 186 countries with reliable GDP per capita data, the Central African Republic has the lowest GDP per capita.
The graphs that appear in this chapter are:
- Figure 0.1 GDP per Capita, 2014 (Thousands of Dollars)
- Figure 0.2 Growth in GDP per Capita, 2005–2014 (Percent)
- Figure 0.3 Net National Savings Rate, 2014 (Percent of GNI)
- Figure 0.4 Government Debt (Percent of GDP)
- Figure 0.5 Labor Productivity, 2014 (GDP per Hour Worked)
- Figure 0.6 Average Annual Hours Worked, 2014 (Lowest to Highest)
- Figure 0.7 Unemployment Rate, 2014 (Percent of Labor Force, Lowest to Highest)
- Figure 0.8 Average Annual Inflation Rate, 2005–2014 (Lowest to Highest)
- Figure 0.9 General Government Revenue, 2014 (Percent of GDP)
- Figure 0.10 Trade Balance (Percent of GDP)
- Figure 0.11 Gini Coefficient (Most Equal to Least Equal)
- Figure 0.12 Percent of Population Living Below $1.90/Day Poverty Line, 2012
- Figure 0.13 Official Development Assistance, 2015 (Percent of GNI)
- Figure 0.14 Internet Users per 100 People, 2014
- Figure 0.15 Average PISA Science Test Score, 2012 (15-year-olds)
- Figure 0.16 Life Expectancy at Birth, 2015
- Figure 0.17 Average Life Satisfaction, 2010–2014 Results (1 = Dissatisfied, 10 = Satisfied)
- Figure 0.18 Carbon Dioxide Emissions per Capita, 2011 (Metric Tons per Year)
- Figure 0.19 Average National Particulate Matter Concentration, 2013 (Micrograms per Cubic Meter)
Box 0.1 GDP Per Capita
- What it is: Media stories of economic performance frequently refer to gross domestic product (GDP). A country’s GDP per capita measures economic production per person per year, which gives us an idea of the average material living standards in the country. While GDP is perhaps the most commonly used macroeconomic metric, it does not necessarily measure well-being. We discuss how GDP is calculated in Chapter 5 and the limitations of and alternatives to GDP in Chapter 6.
- The results: European Union countries cover a wide range in the ranking. Luxembourg ranks third, with a GDP per capita of around $98,000. Bulgaria ranks 69th, with a GDP per capita of $17,000. Were the EU one country, it would rank 30th, with a GDP per capita of around $37,000. In 2014, a year with still high oil prices, oil-producing Qatar had the world’s highest GDP per capita at around $141,000, and the Central African Republic had the lowest, at only $590.
■ Figure 0.1 GDP per Capita, 2014 (Thousands of Dollars)
Box 0.2 RECENT GROWTH RATE OF GDP PER CAPITA
- What it is: In macroeconomics, we seek to explain not only why some countries have a higher GDP per capita but also what conditions lead to strong GDP growth rates. In this graph, we compare the growth in GDP per capita, after adjusting for inflation, across countries over the 10-year period 2005–2014. We discuss measuring GDP growth rates in Chapter 5 and theories of GDP growth in Ch...