Autonomous vehicle (AV) technology represents a possible paradigm shift in our way of life. But complex challenges and obstacles impose a reality at odds with the utopian visions propounded by AV enthusiasts in the private and public sectors.
The new volume in the Urban Agenda series examines the technological questions still surrounding autonomous vehicles and the uncertain societal and legislative impact of widespread AV adoption. Assessing both short- and long-term concerns, the authors probe how autonomous vehicles might change transportation but also land use, energy consumption, mass transit, commuter habits, traffic safety, job markets, the freight industry, and supply chains. At the same time, the essays discuss opportunities for industry, researchers, and policymakers to make the autonomous future safer, more efficient, and more mobile.
Contributors: Austin Brown, Stan Caldwell, Chris Hendrickson, Kazuya Kawamura, Taylor Long, and P. S. Srira.
- English
- ePUB (mobile friendly)
- Available on iOS & Android
eBook - ePub
About this book
Trusted by 375,005 students
Access to over 1.5 million titles for a fair monthly price.
Study more efficiently using our study tools.
Information
Publisher
University of Illinois PressYear
2020Print ISBN
9780252085468
9780252043567
eBook ISBN
9780252052446
PART ONE
OVERVIEW
Autonomous Vehicles and Mobility Impacts on Transit and Freight
Factors Affecting Adoption, Challenges, and Opportunities
P. S. SRIRAJ
Autonomous vehicle technology has been discussed for the better part of two decades in various forms. The terms connected vehicles, automated vehicles, and autonomous vehicles have all been used to refer to this paradigm shift. Connected vehicles are those that are virtually connected to each other and the surrounding infrastructure so that they can behave and function in a safe manner.
Autonomous vehicles, on the other hand, are those that have different levels of automation leading up to complete automation and driverless technology. Autonomous vehicle (AV) technology is predicted to be the future of surface transportation; depending on how it is unveiled, regulated, and adopted, AV technology has the ability to galvanize transportation in general and mobility in particular.1 The removal of human factors from vehicle operation could potentially improve safety by reducing crashes and could have a positive impact on the environment by reducing energy consumption.
Much as the advent of automobiles changed land use patterns around the world, the emergence of AVs coupled with clean energy can have significant influences on land use and travel. While the term autonomous vehicle is used in general, the National Highway Traffic Safety Administration (NHTSA) designates different levels of autonomy/automation:2
Level 0: Human driver is in complete control.
Level 1: One function is automated (e.g., forward collision and lane departure warning systems, blind spot assist).
Level 2: Many features are automated simultaneously (e.g., steering and acceleration), but the driver must remain alert.
Level 3: Driving is sufficiently automated that the driver can engage in other activities.
Level 4: The car can drive itself without a human driver.
BACKGROUND
The automobile’s dominance as a mode of transportation in the USA has been well documented. The reasons for this are manifold, starting from population density, sprawling urban areas, and spatial mismatch between origins and destinations within a region, further encouraged by increases in safety and fuel efficiency over the last few decades. One metric that presents this dominance in a transparent manner is the vehicle miles traveled (VMT).
The VMT for the nation has been steadily trending upward over the past several years (figure 1). As of 2018, the VMT was 3.21 trillion miles, an increase of a little more than 2 trillion miles from 1.13 trillion in 1971.3 This increase in VMT is coupled with the increase in car registrations (124 million in 20174 compared to roughly 62 million in 1960). The number of trucks registered in the US as of 2016 was about 152 million (compared to about 12 million in 1960, according to the Transportation Energy Data Book). The average age of these cars and trucks is roughly twelve years. The VMT contribution from the 113 million cars was around 44 percent. Thus, car ownership has been increasing, along with the vehicle miles traveled. The resultant impact on daily travel is an increase in travel times. There are various measures of congestion, which are based on the average hours of delay motorists endure. The Bureau of Transportation Statistics (BTS) publishes one such measure, called the Roadway Congestion Index (RCI, figure 2). The RCI measures vehicle travel density on major roadways in urban areas. An RCI value greater than 1.0 indicates an undesirable congestion level, on the freeways and principal arterial street systems during the peak period.
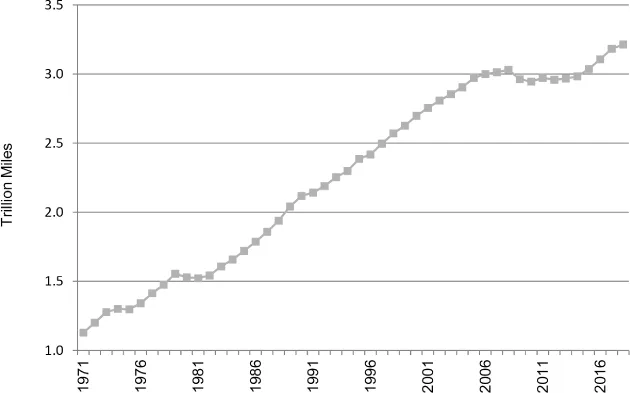
Figure 1. Annual vehicle miles traveled (VMT) in the United States. The VMT for the nation has been steadily trending up over the past several years despite the emerging shared mobility options in the form of ride-sharing, micromobility, and other options. Based on data from the US Department of Energy, Alternative Fuels Data Center.
The RCI metric has increased from 1981 to 2008 with only a slight decrease evidenced between 2008 and 2011 during periods of economic downturn. Even with the decrease, urban areas defined as “very large” and “large” have been well above the threshold of 1.0, indicating that travel conditions have been congested and undesirable in those areas. The increase in congestion and associated delays lead to more roadway incidents that compromise the safety of the traveling public. Fatalities on US roadways have increased significantly in the last ten years, to approximately 40,000 deaths per year.5 This is up from the almost 31,000 deaths in 2009. The reasons for this are many and include distracted driving.6
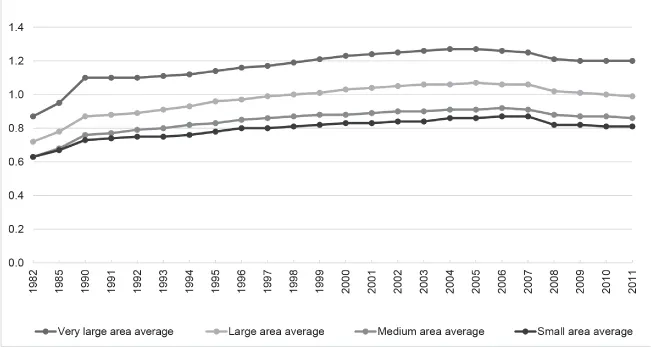
Figure 2. Roadway Congestion Index (RCI). The RCI measures vehicle travel density on major roadways in an urban area. An RCI value greater than 1.0 indicates an undesirable congestion level on freeways and principal arterial street systems during the peak period.
Thus, the current state of road traffic cannot sustain for long. The time is ripe for a paradigm shift in the way transportation is served and consumed. That paradigm shift, according to many experts, could be coming in the form of AVs, apart from achieving optimal modal balance (non-motorized modes, telecommuting, carpools, etc.) that might reduce the inherent gaps in the transportation system.
TECHNOLOGY ABSORPTION
While developing a technology involves inspiration and innovation, getting that technology to be embraced by its target audience is equally important and equally difficult. In this regard, knowing the history of technology innovation and understanding the fundamental theoretical underpinnings of technology adoption will help prepare all the stakeholders who will be affected by the technology. These stakeholders include manufacturers of the technology, public policy makers, and end users.
Human civilization has always been inspired to innovate, and technological innovations have been instrumental in changing many paradigms in our daily lives. Innovations such as the automobile and mobile/smartphones have revolutionized how people interact. Each of these inventions had a gestation period before it percolated to a larger population. This gestation period, which includes technology diffusion and technology acceptance, has been studied by researchers in order to provide a basis of understanding for how society will receive future innovations and what innovators and inventors can do to present their products appropriately. Diffusion tends to be a slow process and varies for different inventions (Hall and Khan, 2002). Predictions of technology acceptance, on the other hand, have been modeled as an S-curve/bell curve or using the Technology Acceptance Model. In a variation of the typical S-curve, early innovators create a product and take it to the market, where it is embraced first by a few early adopters, followed by early majority users, late majority users, and finally latecomers/skeptics, also referred to as laggards.
Through the course of history, personal attitudes and beliefs have influenced the acceptance of new technology and its eventual absorption on a wider scale. Trust has also been found to play a significant role in the adoption of a new technology.7 In this context, it is important to understand the external factors that influence trust, be it in a positive manner or a negative manner. The literature on user acceptance of commercial products, especially in computer/information technology, revolves around the Technology Acceptance Model (TAM).8 This line of research broadly argues that individuals’ general beliefs and perceptions about technology use help form their attitudes toward a specific technology, and that those attitudes in turn determine their intention to adopt or not to adopt an innovation.
The TAM, proposed in 1989 by Davis, Bagozzi, and Warshaw, postulated that users’ intention and behavior are based on their perception about the usefulness of the technology and the ease of use associated with that technology.9 “Perceived usefulness” refers to a prospective user’s degree of belief in a new technology’s ability to enhance their individual performance, whereas “perceived ease of use” refers to the belief that the technology requires minimal effort and averts risk. Others have expanded on the TAM by postulating that the intention to use the technology is also a significant predictor of actual use.10 However, the intention to use does not necessarily translate to actual use due to various other factors, including market economics and resource availability. In addition, factors such as the technology’s design, the training and education needed to operate it, and its universality ultimately play a role in how successful a new technology is going to be.
TAM and other such theories provide AV manufacturers a peek into the user beliefs and attitudes that affect adoption. Factors such as the ease of use, as well as the applicability and usefulness of an autonomous fleet for a wide audience, different trip types, and varying geographies, have been shown to play a part in influencing the behavior and intent to use this new technology. The literature has identified two other factors related to technology adoption: perceived trustworthiness of the technology and perceived trustworthiness of the agency providing the service.
While it is beneficial to understand the factors that affect adoption of a technology, it is equally critical to understand the transportation system and the key modes within the system. There are significant systemic issues surrounding each mode and its preparedness to infuse innovation into its ranks. These are presented next for three major modes in transportation.
MODAL PERSPECTIVES ABOUT AUTONOMOUS VEHICLES
The discussion about AVs has rarely been as nuanced as it ought to be. The majority of the literature since 2012 on AVs and the policies affecting them has looked from the lens of a highway mode of transportation and primarily from the perspective of the private automobile.11 While this narrative is accurate—private automobiles may be the largest consumer of the technology—it still behooves us to deliberate about the potential implications and ramifications of this technology immersion from a modal perspective.
Motorized surface transportation includes public transportation, freight transportation (over-the-road trucks), and more recently e-scooters and other emerging technologies. While all of these are surface transportation modes, they have their own challenges to overcome.
Highway
As seen earlier, congestion on road networks has been increasing, causing delays that are costly to users and resulting in more pollution from emissions. Congestion has not shown any signs of mitigating despite all the investment in road networks and the construction of new infrastructure.
On average, because of congestion, a commuter in a Very Large urban area spends around $1,440 per year in lost time and wasted fuel (figure 3). For the nation as a whole, this balloons to about $179 billion a year.12 Policymakers and planners have long tried various strategies to mitigate congestion, but some are ineffective. Research has shown, for example, that adding supply (adding a lane) does not reduce congestion because the added lanes attract more induced demand than the increased supply, thereby creating a vicious cycle that is difficult to break.13 Another, more successful way to curb congestion is through appropriate demand-management strategies.
The most successful and effective strategies have all been tied to parking and pricing. Congestion pricing works to shift a share of peak-hour trips either to off-peak periods or to other modes of travel, such as public transportation or ridesharing (carpool, vanpool, subscription buses, etc.).14 It does this by levying a surcharge to vehicles ...
Table of contents
- Cover
- Title
- Copyright
- Contents
- Preface and Acknowledgments Michael A. Pagano
- Part One: Overview
- Part Two: White Papers
- Part Three: Synopsis
- List of Contributors
- Backcover
Frequently asked questions
Yes, you can cancel anytime from the Subscription tab in your account settings on the Perlego website. Your subscription will stay active until the end of your current billing period. Learn how to cancel your subscription
No, books cannot be downloaded as external files, such as PDFs, for use outside of Perlego. However, you can download books within the Perlego app for offline reading on mobile or tablet. Learn how to download books offline
We are an online textbook subscription service, where you can get access to an entire online library for less than the price of a single book per month. With over 1.5 million books across 990+ topics, we’ve got you covered! Learn about our mission
Look out for the read-aloud symbol on your next book to see if you can listen to it. The read-aloud tool reads text aloud for you, highlighting the text as it is being read. You can pause it, speed it up and slow it down. Learn more about Read Aloud
Yes! You can use the Perlego app on both iOS and Android devices to read anytime, anywhere — even offline. Perfect for commutes or when you’re on the go.
Please note we cannot support devices running on iOS 13 and Android 7 or earlier. Learn more about using the app
Please note we cannot support devices running on iOS 13 and Android 7 or earlier. Learn more about using the app
Yes, you can access Are We There Yet? by Michael A. Pagano in PDF and/or ePUB format, as well as other popular books in Politics & International Relations & City Planning & Urban Development. We have over 1.5 million books available in our catalogue for you to explore.