Policy makers often call for increased spending on infrastructure, which can encompass a broad range of investments, from roads and bridges to digital networks that will expand access to high-speed broadband. Some point to the near-term macroeconomic benefits, such as job creation, associated with infrastructure spending; others point to the long-term effects of such spending on productivity and economic growth.
Economic Analysis and Infrastructure Investment explores the links between infrastructure investment and economic outcomes, analyzing key economic issues in the funding and management of infrastructure projects. It includes new research on the short-run stimulus effects of infrastructure spending, develops new estimates of the stock of US infrastructure capital, and explores incentive aspects of public-private partnerships with particular attention to their allocation of risk. The volume provides a reference for researchers seeking to study infrastructure issues and for policymakers tasked with determining the appropriate level and allocation of infrastructure spending.

eBook - ePub
Economic Analysis and Infrastructure Investment
- English
- ePUB (mobile friendly)
- Available on iOS & Android
eBook - ePub
Economic Analysis and Infrastructure Investment
About this book
Trusted by 375,005 students
Access to over 1.5 million titles for a fair monthly price.
Study more efficiently using our study tools.
Information
1
Measuring Infrastructure in BEA’s National Economic Accounts
Jennifer Bennett, Robert Kornfeld, Daniel Sichel, and David Wasshausen
1.1 Introduction
Infrastructure provides critical support to the economy and contributes in an important way to living standards; assessing the economic role of infrastructure requires defining and measuring it.1 That task is the topic of this chapter. We focus on the measurement of infrastructure in the US National Economic Accounts to highlight the availability of these data and to gauge trends in recent decades; in particular, has investment in infrastructure by the public and private sectors (and the associated capital stocks) kept up with key measures such as population and gross domestic product (GPD)?2 Assessing these trends is particularly valuable given ongoing changes in the nature of infrastructure, as networks, connectivity, alternative-energy infrastructure, and digital and intangible infrastructure have become increasingly important and the focus of policy debates.
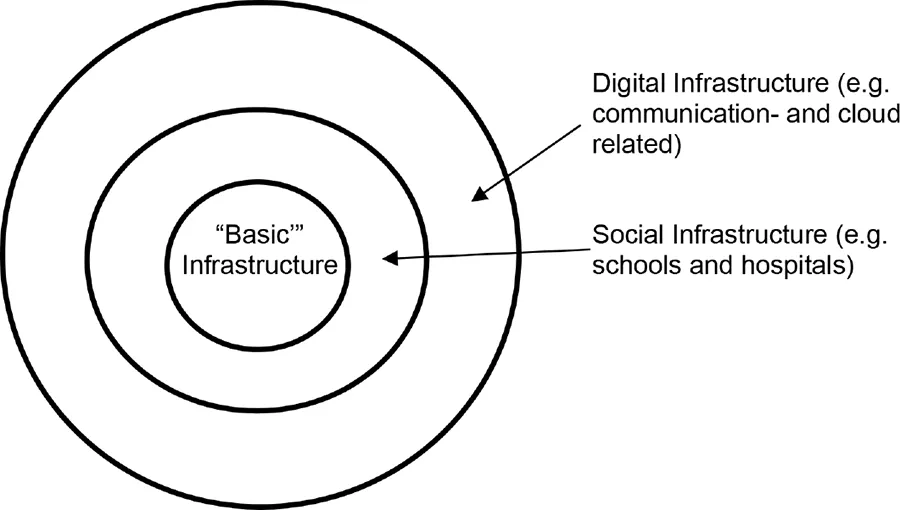
Fig. 1.1 Basic, social, and digital infrastructure
We begin with the challenging question of how to define “infrastructure.” Defining the economic boundaries of infrastructure is imprecise and somewhat subjective. We consider three broad categories of infrastructure that can gauge different aspects of infrastructure from a National Economic Accounts standpoint. “Basic” infrastructure (such as transportation and utilities) reflects a traditional definition of infrastructure. From there, we expand that core to include additional economic activity that would potentially be included in infrastructure, including social and digital infrastructure.3 Figure 1.1 illustrates this idea of basic or core infrastructure surrounded by broader concepts of infrastructure. Moreover, within each of these types, some infrastructure is owned by the public sector and some by the private sector.
After providing details on this framework for defining infrastructure, we describe the methodologies and the source data used by the Bureau of Economic Analysis to estimate US infrastructure investment, depreciation, and net stocks.
With definitions in hand, we consider different metrics for gauging levels and trends of US infrastructure. In addition to measures for overall infrastructure, we will consider infrastructure by broad category, by detailed type, and by public or private ownership. Our data analysis covers the following topics, with our main conclusions briefly summarized here as well.
1.1.1 Investment and Capital Stocks
In terms of the composition of infrastructure stocks, the share of gross investment in basic infrastructure out of all infrastructure has fallen since the late 1950s, while the shares of social and digital infrastructure have increased. For net capital stocks, the share of basic infrastructure has fallen while the share of social has risen.
In terms of ownership, the share of the infrastructure capital stock that is publicly owned (both state and local ownership) has increased since the late 1950s, while the privately owned share has fallen. An important contributor to the decline in the private share is the huge drop in the investment share of privately owned railroads.
Gross real investment in infrastructure has trended up for most types of infrastructure, though patterns are widely mixed across asset types. These data highlight the resources devoted to different types of infrastructure each year and provide a useful overview of trends. These data also are closest to the source data before translation into net investment or capital stock measures (which rely on estimates and assumptions about depreciation).
Regarding trends in the budget resources devoted to infrastructure, gross real investment per capita has gently drifted up since the early 1980s. However, depreciation has absorbed a rising share of that investment, and real net investment per capita has barely risen.
Growth rates of real net capital stocks per capita also provide a metric for assessing how well infrastructure investment has kept up. This metric is particularly interesting because of its connection to measures of the contribution of capital to productivity growth. For this metric, the real net stock of basic infrastructure per capita has been soft for a long time, running below a 1 percent pace. For social infrastructure, this metric rose at more than a 2 percent pace during the 2000s, but since the financial crisis its growth rate has been around just 1 percent. The growth rate of the real net stock of digital infrastructure per capita has been much higher than that of other types of infrastructure, though that rate has been quite volatile. It is difficult to draw strong conclusions from these figures, but infrastructure investment certainly has, in general, not been growing rapidly (with the exception of digital infrastructure, some categories of electric power, medical equipment, and a few other categories).
1.1.2 State-Level Data
As interesting as national measures of infrastructure are, infrastructure is built in a particular region and has particular benefits for that region. In addition, to state the obvious, the geographic distribution of infrastructure carries considerable political salience. However, the National Economic Accounts do not, in general, include information on regional breakdowns of infrastructure. To get some visibility into the geographic distribution of infrastructure, we present new prototype measures on highway investment by state.4 These estimates show tha...
Table of contents
- Cover
- Copyright
- Title Page
- Series Page
- National Bureau of Economic Research
- Relation of the Directors to the Work and Publications of the NBER
- Contents
- Acknowledgments
- Introduction
- 1. Measuring infrastructure in BEA’s National Economic Accounts
- 2. Can America Reduce Highway Spending? Evidence from the States
- 3. Transportation infrastructure in the US
- 4. The Macroeconomic Consequences of Infrastructure Investment
- 5. Procurement Choices and Infrastructure Costs
- 6. When and How to Use Public-Private Partnerships in infrastructure: Lessons from the international Experience
- 7. A Fair Value approach to Valuing Public infrastructure Projects and the Risk Transfer in Public-Private Partnerships
- 8. Digital Infrastructure
- Notes
- Contributors
- Author Index
- Subject Index
Frequently asked questions
Yes, you can cancel anytime from the Subscription tab in your account settings on the Perlego website. Your subscription will stay active until the end of your current billing period. Learn how to cancel your subscription
No, books cannot be downloaded as external files, such as PDFs, for use outside of Perlego. However, you can download books within the Perlego app for offline reading on mobile or tablet. Learn how to download books offline
Perlego offers two plans: Essential and Complete
- Essential is ideal for learners and professionals who enjoy exploring a wide range of subjects. Access the Essential Library with 800,000+ trusted titles and best-sellers across business, personal growth, and the humanities. Includes unlimited reading time and Standard Read Aloud voice.
- Complete: Perfect for advanced learners and researchers needing full, unrestricted access. Unlock 1.5M+ books across hundreds of subjects, including academic and specialized titles. The Complete Plan also includes advanced features like Premium Read Aloud and Research Assistant.
We are an online textbook subscription service, where you can get access to an entire online library for less than the price of a single book per month. With over 1.5 million books across 990+ topics, we’ve got you covered! Learn about our mission
Look out for the read-aloud symbol on your next book to see if you can listen to it. The read-aloud tool reads text aloud for you, highlighting the text as it is being read. You can pause it, speed it up and slow it down. Learn more about Read Aloud
Yes! You can use the Perlego app on both iOS and Android devices to read anytime, anywhere — even offline. Perfect for commutes or when you’re on the go.
Please note we cannot support devices running on iOS 13 and Android 7 or earlier. Learn more about using the app
Please note we cannot support devices running on iOS 13 and Android 7 or earlier. Learn more about using the app
Yes, you can access Economic Analysis and Infrastructure Investment by Edward L. Glaeser, James M. Poterba, Edward L. Glaeser,James M. Poterba,Edward Glaeser in PDF and/or ePUB format, as well as other popular books in Business & Business General. We have over 1.5 million books available in our catalogue for you to explore.