![]()
SECTION 1
Business as Usual,
No Longer?
![]()
CHAPTER 1
Income Growth and
Redistribution in
Singapore: Issues and
Challenges
PAUL CHEUNG
INTRODUCTION
Singapore's economy has done exceptionally well in the past decades. This strong economic growth has led to a rapid rise in the income and wealth of the population, resulting in a prosperous Singapore and a high standard of living. With almost full employment and a high quality of life, Singapore's achievements have become the envy of many developing countries.
As the Singapore economy continues to expand, issues on income equality have emerged as there is increasing evidence that the distribution of income and wealth is trending towards greater distortion. Similar to that of the developed world, the relationship between economic growth and household income in Singapore is increasingly complicated by the changing output and reward structure. This is particularly so for Singapore which has an open, globalised, technologically-oriented economy and serves as an economic hub for the region. Income differentiation across occupations is increasingly stretched. As a result, household income growth of the middle and working class appears to be affected both by how the proceeds of production are being distributed as well as by how much the output has grown. Singapore's situation is also complicated by the influx of foreign workforce at various skill levels.
This chapter addresses three issues on income growth and distribution in Singapore. First, it examines the size of the income pie by assessing the structure and trends of two key components of Gross Domestic Product (GDP) — Compensation of Employees (CE) and Gross Operating Surplus (GOS). It pays particular attention to the size of the CE and its share in the GDP over time and examines the question of whether the size of the income pie could be increased further through structural changes. Second, having established the size of the pie, it will show how the total income is being distributed across the population. The impact of the income distribution on the middle and the working class will be scrutinised. Third, given the current pattern of income growth and distribution, the chapter will assess the competitive landscape of upward mobility in Singapore and its implications by focusing on a key segment of the population which is at the critical stage of establishing their career: the 30–39 age group. Some policy challenges will be highlighted.
DISTRIBUTION OF THE PROCEEDS OF PRODUCTION
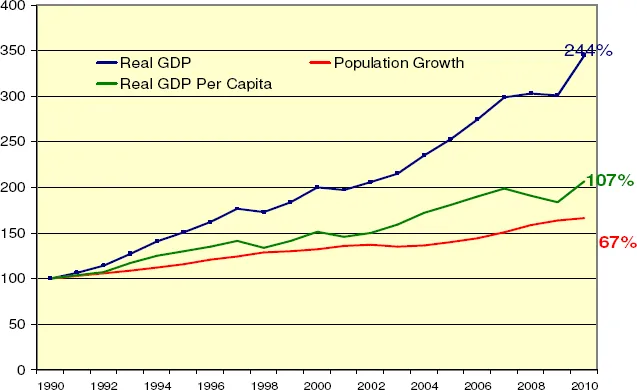
Singapore's economy has done exceptionally well since 1990. Real GDP increased by an annual average rate of 6.4 per cent between 1990 and 2010 (Figure 1). Cumulative real GDP growth during the period was 244 per cent. Real GDP growth was negative only in 1998 (due to the Asian financial crisis), in 2001 (due to the 9/11 incident and the collapse of the technology bubble) and in 2009 (due to the global financial crisis). This track record demonstrates the underlying strength of the Singapore economy and its resilience to external shocks.
With the exception of four years (1998, 2001, 2008 and 2009), real GDP growth was higher than population growth which was substantial by international standard. Thus, real GDP per capita increased for all years except these four years during the 1990–2010 period. Annual average growth in real GDP per capita was 3.7 per cent during this period. Cumulatively, real GDP per capita growth was 107 per cent.
Figure 1 Real GDP, real GDP per capita (2005 Prices) & population (1990 = 100)
Source: GDP and Population Data from Singapore Department of Statistics.
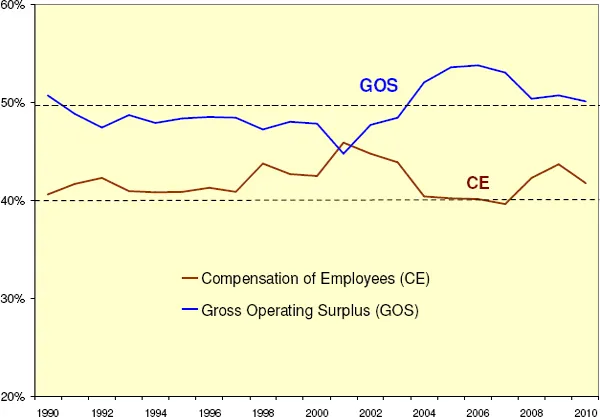
While the performance of Singapore's economy since 1990 has been laudable, it is important to assess how the fruits of economic growth have been shared between workers and businesses. The distributional aspects of GDP may be more important due to changes in the structure of the economy and the consequent changes in the ways rewards are being disbursed. Figure 2 shows the trends in the distribution of the proceeds of production in terms of the shares of Compensation of Employees (CE) and Gross Operating Surplus (GOS) in nominal GDP.1 It is worth noting that the share of CE or wage share has remained roughly the same throughout 1990 and 2010, except for 2001 and 2002 where its share registered significant increases. The share of GOS or profits has mostly exceeded the wage share. The data suggest that the distribution of the proceeds of production has remained relatively stable even as the size of the economy or output has grown. This means also that the level of total compensation is growing at roughly the same pace as GDP, but there are no structural changes within the economy leading to an increase in its share.
Figure 2 Share of compensation of Employees & Gross Operating Surplus in NGDP
Source: Singapore Department of Statistics
COULD THE WAGE SHARE GET BIGGER OVER TIME?
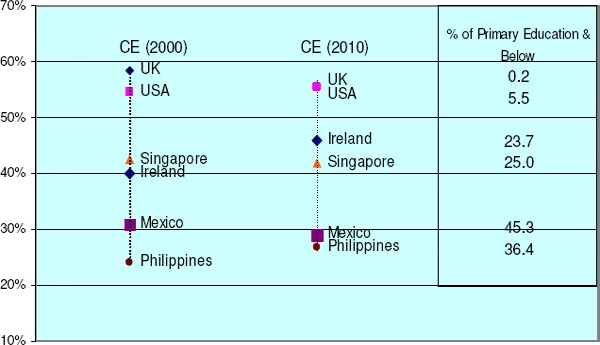
In an earlier chapter by Department of Statistics (DOS)2, it has been shown that Singapore's wage share, trending at about 40 per cent, is consistently lower than that of the OECD countries. Figure 3 shows that the share of CE for Singapore was lower than that of the established, developed economies such as the United Kingdom and the United States which had shares consistently above 50 per cent. Singapore's share is consistent with the emerging economies and is linked to lower wage level and lower productivity growth. If we use education level as a proxy for higher productivity and resulting wage level, we would expect a positive relationship between wage share and higher education. Figure 3 shows clearly this positive relationship, demonstrating that an economy with higher educated workforce also has a higher wage share. Singapore's figure could be considerably high if we include the foreign workers in the computation.
DOS attributed the persistent stability to the fact that, in Singapore, productivity increases had kept pace with wage growth. It further argued that attempts to artificially move wage share up by raising wages above productivity would be counter-productive leading to a loss of economic competitiveness. Structurally, based on the earlier analysis by DOS, the financial services and transport and communications industries seem to offer the best possibilities for contributing to the rise in wage share as their wage share is surprisingly low. The stability in CE could also result from the workforce moving from wage employment to self-employment. However, there is no evidence that, over time, the prevalence of self-employment is trending higher.
Figure 3 Compensation of Employees (CE) in NGDP
Source: Computed from Official Data at OECD, Singapore Department of Statistics and Institute of Statistics, UNESCO
The analysis on the wage share suggests that while the GDP will grow higher as the economy expands, the amount of income to be distributed to the population will roughly grow at the same rate as the GDP growth. It will be difficult to expect further significant increases in the wage share through structural or policy changes. Simulations have shown that increasing the wages of the foreign worker and imposing minimum wages across the board would have positive impact on the wage share. But this would no doubt have an adverse impact on the competitiveness of Singapore labour costs.
DISTRIBUTION AND GROWTH OF HOUSEHOLD INCOME
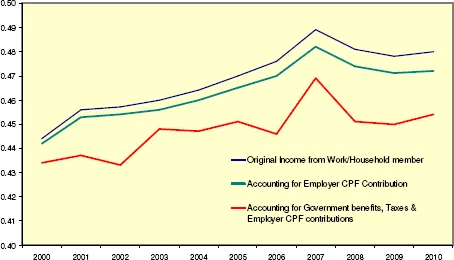
Having addressed the question of how big is the income pie (the level and trend of the total compensation of employees), we need now to examine how the pie is distributed among the households over time. Figure 4 shows the rising trend in the Gini coefficients3 for resident employed households during the 2000–2010 period.4 Even after allowing for government benefits and taxes and employer contributions to the Central Provident Fund (CPF), income inequality among these households has increased in Singapore, suggesting that the gains from sustained economic growth in Singapore over the period have not been evenly shared among the resident households. Indeed, the 2010 Human Development Report shows that Singapore has the second highest Gini coefficient among the ‘Very High Human Development Level Countries’, reflecting a more unequal income distribution among this group of countries.
Figure 4 Gini coefficients, 2000–2010
Source: Singapore Department of Statistics, Key Household Income Trends 2010, February 2011
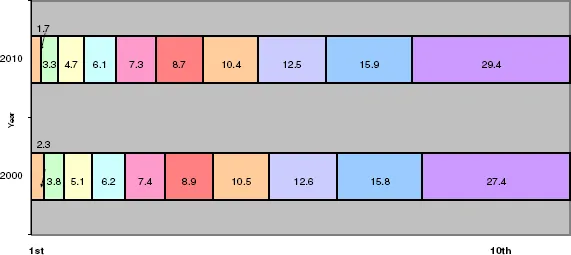
Figure 5 shows the rising income inequality from another perspective by showing the relative share of total household income for resident employed households by deciles. In 2000, households in the tenth (top) decile had a disproportionate share of total household income at 27.4 per cent. Their share increased further to almost 30 per cent in 2010. Except for the 9th and 10th deciles, all other groups have experienced a decline in the income share (Figure 6). Over this period, the upper income groups have increased their claim on the total income.
Figure 5 Share of deciles in total income of resident employed households, 2000 & 2010
Source: Computed from Singapore Department of Statistics, Key Household Income Trends 2010, February 2011
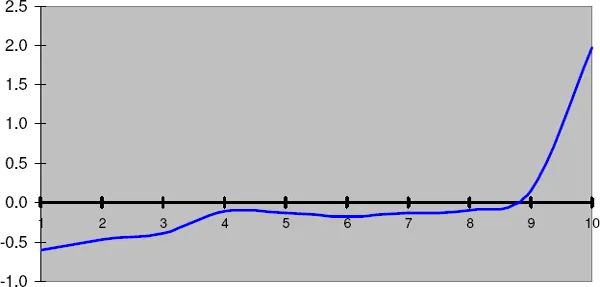
Figure 6 Intercensual differential in income share
Source: Computed from figures in Figure 5
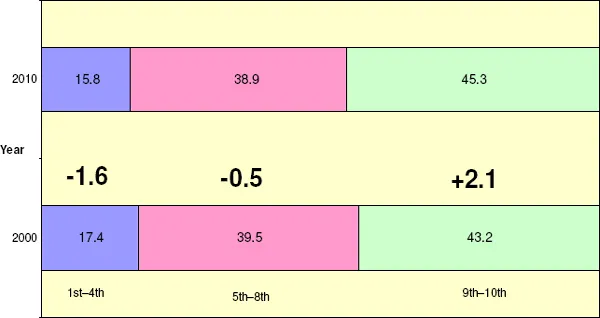
Figure 7 Share in Total Income of Resident Employed Households by Decile, 2000 & 2010
Source: Computed from figures in Figure 5
This decline in income share by the bulk of Singapore households is further illustrated in Figure 7. The 9th and 10th deciles were the only groups to experience an increase in their share of total household income, of about 2.1 percentage points. The middle class deciles (5th to 8th) barely managed to hold on the same income share as compared with the share in 2000, registering a decline in share ...