eBook - ePub
Statistical Techniques for Data Analysis
John K. Taylor, Cheryl Cihon
This is a test
- 296 Seiten
- English
- ePUB (handyfreundlich)
- Über iOS und Android verfügbar
eBook - ePub
Statistical Techniques for Data Analysis
John K. Taylor, Cheryl Cihon
Angaben zum Buch
Buchvorschau
Inhaltsverzeichnis
Quellenangaben
Über dieses Buch
Since the first edition of this book appeared, computers have come to the aid of modern experimenters and data analysts, bringing with them data analysis techniques that were once beyond the calculational reach of even professional statisticians. Today, scientists in every field have access to the techniques and technology they need to analyze stat
Häufig gestellte Fragen
Wie kann ich mein Abo kündigen?
Gehe einfach zum Kontobereich in den Einstellungen und klicke auf „Abo kündigen“ – ganz einfach. Nachdem du gekündigt hast, bleibt deine Mitgliedschaft für den verbleibenden Abozeitraum, den du bereits bezahlt hast, aktiv. Mehr Informationen hier.
(Wie) Kann ich Bücher herunterladen?
Derzeit stehen all unsere auf Mobilgeräte reagierenden ePub-Bücher zum Download über die App zur Verfügung. Die meisten unserer PDFs stehen ebenfalls zum Download bereit; wir arbeiten daran, auch die übrigen PDFs zum Download anzubieten, bei denen dies aktuell noch nicht möglich ist. Weitere Informationen hier.
Welcher Unterschied besteht bei den Preisen zwischen den Aboplänen?
Mit beiden Aboplänen erhältst du vollen Zugang zur Bibliothek und allen Funktionen von Perlego. Die einzigen Unterschiede bestehen im Preis und dem Abozeitraum: Mit dem Jahresabo sparst du auf 12 Monate gerechnet im Vergleich zum Monatsabo rund 30 %.
Was ist Perlego?
Wir sind ein Online-Abodienst für Lehrbücher, bei dem du für weniger als den Preis eines einzelnen Buches pro Monat Zugang zu einer ganzen Online-Bibliothek erhältst. Mit über 1 Million Büchern zu über 1.000 verschiedenen Themen haben wir bestimmt alles, was du brauchst! Weitere Informationen hier.
Unterstützt Perlego Text-zu-Sprache?
Achte auf das Symbol zum Vorlesen in deinem nächsten Buch, um zu sehen, ob du es dir auch anhören kannst. Bei diesem Tool wird dir Text laut vorgelesen, wobei der Text beim Vorlesen auch grafisch hervorgehoben wird. Du kannst das Vorlesen jederzeit anhalten, beschleunigen und verlangsamen. Weitere Informationen hier.
Ist Statistical Techniques for Data Analysis als Online-PDF/ePub verfügbar?
Ja, du hast Zugang zu Statistical Techniques for Data Analysis von John K. Taylor, Cheryl Cihon im PDF- und/oder ePub-Format sowie zu anderen beliebten Büchern aus Mathematics & Probability & Statistics. Aus unserem Katalog stehen dir über 1 Million Bücher zur Verfügung.
Information
CHAPTER 1
What are Data?
Data may be considered to be one of the vital fluids of modern civilization. Data are used to make decisions, to support decisions already made, to provide reasons why certain events happen, and to make predictions on events to come. This opening chapter describes the kinds of data used most frequently in the sciences and engineering and describes some of their important characteristics.
DEFINITION OF DATA
The word data is defined as things known, or assumed facts and figures, from which conclusions can be inferred. Broadly, data is raw information and this can be qualitative as well as quantitative. The source can be anything from hearsay to the result of elegant and painstaking research and investigation. The terms of reporting can be descriptive, numerical, or various combinations of both. The transition from data to knowledge may be considered to consist of the hierarchal sequence
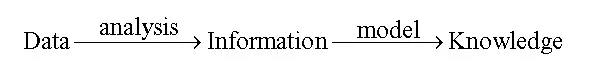
Ordinarily, some kind of analysis is required to convert data into information. The techniques described later in this book often will be found useful for this purpose. A model is typically required to interpret numerical information to provide knowledge about a specific subject of interest. Also, data may be acquired, analyzed, and used to test a model of a particular problem.
Data often are obtained to provide a basis for decision, or to support a decision that may have been made already. An objective decision requires unbiased data but this should never be assumed. A process used for the latter purpose may be more biased than one for the former purpose, to the extent that the collection, accumulation, or production process may be biased, which is to say it may ignore other possible bits of information. Bias may be accidental or intentional. Preassumptions and even prior misleading data can be responsible for intentional bias, which may be justified. Unfortunately, many compilations of data provide little if any information about intentional biases or modifying circumstances that could affect decisions based upon them, and certainly nothing about unidentified bias.
Data producers have the obligation to present all pertinent information that would impact on the use of it, to the extent possible. Often, they are in the best position to provide such background information, and they may be the only source of information on these matters. When they cannot do so, it may be a condemnation of their competence as metrologists. Of course, every possible use of data cannot be envisioned when it is produced, but the details of its production, its limitations, and quantitative estimates of its reliability always can be presented. Without such, data can hardly be classified as useful information.
Users of data cannot be held blameless for any misuse of it, whether or not they may have been misled by its producer. No data should be used for any purpose unless their reliability is verified. No matter how attractive it may be, unevaluated data are virtually worthless and the temptation to use them should be resisted. Data users must be able to evaluate all data that they utilize or depend on reliable sources to provide such information to them.
It is the purpose of this book to provide insight into data evaluation processes and to provide guidance and even direction in some situations. However, the book is not intended and cannot hope to be used as a “cook book” for the mechanical evaluation of numerical information.
KINDS OF DATA
Some data may be classified as “soft” which usually is qualitative and often makes use of words in the form of labels, descriptors, or category assignments as the primary mode of conveying information. Opinion polls provide soft data, although the results may be described numerically. Numerical data may be classified as “hard” data, but one should be aware, as already mentioned, that such can have a soft underbelly. While recognizing the importance of soft data in many situations, the chapters that follow will be concerned with the evaluation of numerical data. That is to say, they will be concerned with quantitative, instead of qualitative data.
Natural Data
For the purposes of the present discussion, natural data is defined as that describing natural phenomena, as contrasted with that arising from experimentation. Observations of natural phenomena have provided the background for scientific theory and principles and the desire to obtain better and more accurate observations has been the stimulus for advances in scientific instrumentation and improved methodology. Physical science is indebted to natural science which stimulated the development of the science of statistics to better understand the variability of nature. Experimental studies of natural processes provided the impetus for the development of the science of experimental design and planning. The boundary between physical and natural science hardly exists anymore, and the latter now makes extensive use of physical measuring techniques, many of which are amenable to the data evaluation procedures described later.
Studies to evaluate environmental problems may be considered to be studies of natural phenomena in that the observer plays essentially a passive role. However, the observer can have control of the sampling aspects and should exercise it, judiciously, to obtain meaningful data.
Experimental Data
Experimental data result from a measurement process in which some property is measured for characterization purposes. The data obtained consist of numbers that often provide a basis for decision. This can range anywhere from discarding the data, modifying it by exclusion of some point or points, or using it alone or in connection with other data in a decision process. Several kinds of data may be obtained as will be described below.
Counting Data and Enumeration
Some data consist of the results of counting. Provided no blunders are involved, the number obtained is exact. Thus several observers would be expected to obtain the same result. Exceptions would occur when some judgment is involved as to what to count and what constitutes a valid event or an object that should be counted. The optical identification and counting of asbestos fibers is an example of the case in point. Training of observers can minimize variability in such cases and is often required if consistency of data is to be achieved. Training is best done on a direct basis, since written instructions can be subject to variable interpretation. Training often reflects the biases of the trainer. Accordingly, serial training (training some one who trains another who, in turn, trains others) should be avoided. Perceptions can change with time, in which case training may need to be a continuing process. Any process involving counting should not be called measurement but rather enumeration.
Counting of radioactive disintegrations is a special and widely practiced area of counting. The events counted (e.g., disintegrations) follow statistical principles that are well understood and used by the practitioners, so will not be discussed here. Experimental factors such as geometric relations of samples to counters and the efficiency of detectors can influence the results, as well. These, together with sampling, introduce variability and sources of bias into the data in much the same way as happens for other types of measurement and thus can be evaluated using the principles and practices discussed here.
Discrete Data
Discrete data describes numbers that have a finite possible range with only certain individual values encountered within this range. Thus, the faces on a die can be numbered, one to six, and no other value can be recorded when a certain face appears.
Numerical quantities can result from mathematical operations or from measurements. The rules of significant figures apply to the former and statistical significance applies to the latter. Trigonometric functions, logarithms, and the value of π, for example, have discrete values but may be rounded off to any number of figures for computational or tabulation purposes. The uncertainty of such numbers is due to rounding alone, and is quite a different matter from measurement uncertainty. Discrete numbers should be used in computation, rounded consistent with the experimental data to which they relate, so that the rounding does not introduce significant error in a calculated result.
Continuous Data
Measurement processes usually provide continuous data. The final digit observed is not the result of rounding, in the true sense of the word, but rather to observational limitations. It is possible to have a weight that has a value of 1.000050...0 grams but not likely. A value of 1.000050 can be uncertain in the last place due to measurement uncertainty and also to rounding. The value for the kilogram (the world’s standard of mass) residing in the International Bureau in Paris is 1.000...0 kg by definition; all other mass standards will have an uncertainty for their assigned value.
VARIABILITY
Variability is inevitable in a measurement process. The operation of a measurement process does not produce one number but a variety of numbers. Each time it is applied to a measurement situation it can be expected to produce a slightly different number or sets of numbers. The means of sets of numbers will differ among themselves, but to a lesser degree than the individual values.
One must distinguish between natural variability and instability. Gross instability can arise from many sources, including lack of control of the process [1]. Failure to control steps that introduce bias also can introduce variability. Thus, any variability in calibration, done to minimize bias, can produce variability of measured values.
A good measurement process results from a conscious effort to control sources of bias and variability. By diligent and systematic effort, measurement processes have been known to improve dramatically. Conversely, negligence and only sporadic attention to detail can lead to deterioration of precision and accuracy. Measurement must entail practical considerations, with the result that precision and accuracy that is merely “good enough”, due to cost-benefit considerations, is all that can be obtained, in all but rare cases. The advancement of the state-of-the-art of chemical analysis provides better precision and accuracy and the related performance characteristics of selectivity, sensitivity, and detection [1].
The inevitability of variability complicates the evaluation and use of data. It must be recognized that many uses require data quality that may be difficult to achieve. There are minimum quality standards required for every measurement situation (sometimes called data quality objectives). These standards should be established in advance and both the producer and the user must be able to determine whether they have been met. The only way that this can be accomplished is to attain statistical control of the measurement process [1] and to apply valid statistical procedures in the analysi...
Inhaltsverzeichnis
- COVER PAGE
- TITLE PAGE
- COPYRIGHT PAGE
- PREFACE
- ACKNOWLEDGMENTS
- DEDICATION
- LIST OF FIGURES
- LIST OF TABLES
- CHAPTER 1: WHAT ARE DATA?
- CHAPTER 2: OBTAINING MEANINGFUL DATA
- CHAPTER 3: GENERAL PRINCIPLES
- CHAPTER 4: STATISTICAL CALCULATIONS
- CHAPTER 5: DATA ANALYSIS TECHNIQUES
- CHAPTER 6: MANAGING SETS OF DATA
- CHAPTER 7: PRESENTING DATA
- CHAPTER 8: PROPORTIONS, SURVIVAL DATA, AND TIME SERIES DATA
- CHAPTER 9: SELECTED TOPICS
- CHAPTER 10: CONCLUSION
- APPENDIX A: STATISTICAL TABLES
- APPENDIX B: GLOSSARY
- APPENDIX C: ANSWERS TO SELECTED NUMERICAL EXERCISES
Zitierstile für Statistical Techniques for Data Analysis
APA 6 Citation
Taylor, J., & Cihon, C. (2004). Statistical Techniques for Data Analysis (2nd ed.). CRC Press. Retrieved from https://www.perlego.com/book/1698894/statistical-techniques-for-data-analysis-pdf (Original work published 2004)
Chicago Citation
Taylor, John, and Cheryl Cihon. (2004) 2004. Statistical Techniques for Data Analysis. 2nd ed. CRC Press. https://www.perlego.com/book/1698894/statistical-techniques-for-data-analysis-pdf.
Harvard Citation
Taylor, J. and Cihon, C. (2004) Statistical Techniques for Data Analysis. 2nd edn. CRC Press. Available at: https://www.perlego.com/book/1698894/statistical-techniques-for-data-analysis-pdf (Accessed: 14 October 2022).
MLA 7 Citation
Taylor, John, and Cheryl Cihon. Statistical Techniques for Data Analysis. 2nd ed. CRC Press, 2004. Web. 14 Oct. 2022.