![]()
Part 1
The Structure and Function of the Human Brain
The more we understand the brain, the better we'll be able to design instruction to match how it learns best.
The human brain is not the largest organ in the body. It weighs only about three pounds, less than the skin covering your body. Yet this marvelous structure is the source of all human behavior, simultaneously controlling a myriad of unbelievably complex functions. Within a span of time too short for humans to measure, it receives information and relays it to the appropriate locations for processing. It then allows you to act on these data by controlling the motor output of your muscles. Your brain generates emotions and lets you be aware of them. It is the source of cognition, memory, thoughts, and what we call intelligence. Your ability to speak and understand the speech of others comes from the brain. You don't have to worry about controlling your heart rate, respiration, breathing, hormone secretion, or immune system; the brain does this for you unconsciously and automatically.
In Part I of this book, we'll take a look at the major structures of the brain and the roles they play.
You may be wondering why you need all this biology. Wouldn't it be sufficient just to outline the general findings about how the brain learns without understanding the structures involved? Isn't it possible to have a general understanding of research findings and perhaps even apply the findings without really comprehending what is going on in the brain? Perhaps, but I believe that if we are to become critical consumers of neuroscience and cognitive science research, or even read reports of this research in the media with any understanding, we need to have a working knowledge of the human brain. Leslie Hart, in his book Human Brain, Human Learning (1983), talks about how little sense it would make to design a device to be used by human hands without being sure that you considered the nature of hands. Neither should we consider designing instruction to teach the human brain without taking into account the brain and how it functions. The more we understand the brain, the better we'll be able to design instruction to match how it learns best. Let us begin our exciting journey into the amazing universe within.
![]()
Chapter 1
Opening the Black Box of the Brain
Introduction
We've learned more about the brain and how it functions in the past three decades than in all of recorded history. What is largely responsible for this explosion of information? The answer lies primarily in improved technology. Many years ago, the only way brains could be studied was by the initially illegal method of autopsy. While studying the brain after death provided a fair amount of information—delineating the areas that allow us to produce and interpret speech, for example—it did little to increase our understanding of how information is processed and stored or why certain students have difficulty learning how to read. Today, imaging techniques allow us to look at the specific brain areas a person uses when recalling a noun versus a verb or when listening to music versus composing a song. We literally can look inside a brain and see which areas are most active while the person is engaged in various mental activities.
The chronology of brain imaging includes many methodologies that, although older and more primitive, remain viable today. As mentioned, the first method was autopsy, which has been in use since the days of Leonardo da Vinci and is still useful. Scientists have learned a great deal about what causes Alzheimer's disease, for example, by studying the brain tissue of those who died of the disease. Scientists have also learned much about the link between structure and function of the brain by studying people who have had brain injuries, strokes, or other traumas.
Animal studies have long been used to increase our understanding of how the brain works. This is possible because all mammalian brains function in a similar manner. Even though many of the methods used with animals cannot be applied to human subjects, we will see in later chapters that these studies often are useful to increase our understanding of human brain functioning.
Early Brain-Imaging Techniques
Today, the black box of the brain is beginning to share its secrets. With the advent of brain-imaging techniques, scientists no longer have to rely on autopsies or injuries to view the brain. Various new forms of technology have greatly increased scientists' ability to see—and sometimes change—what is happening inside the brain. The first of these technologies was developed in the 1800s, but the past 20 years have seen an amazing advance in the sophistication of ways to image the inner functioning of the human brain.
X-Rays
The journey to the present "electronic age" of imaging techniques began with the development of the X-ray, discovered in 1895. X-rays are high-frequency electromagnetic waves that easily penetrate nonmetallic objects. When they do, the atoms in the test object absorb some of the radiation, leaving the unabsorbed portion to strike and expose a photographic plate. The more dense objects show up lighter on the plate, while the less dense objects look darker. Although this process works well if we want to see whether a bone is broken (or what objects you are carrying in your luggage at the airport), it is of little use in depicting the brain and other parts of the body that are largely composed of soft tissue with little contrast in density between areas.
Computerized Axial Tomography (CAT) Scans
In the early 1970s, a technique was developed to increase the gradations in shades of gray from the approximately 25 of the normal X-ray to more than 200. This procedure is called computerized axial tomography (CAT) scanning. It uses X-ray technology but combines several two-dimensional images into a set of three-dimensional "slices." The images that result from a CAT scan look like a grayish X-ray but give a much clearer and more detailed picture of the brain. Neurologists and neurosurgeons routinely use these pictures to locate and determine the extent of tumors or lesions and the loss of tissue. As sophisticated and useful as they are, however, X-rays and CAT scans do not address the brain's function, which is the primary concern of those of us whose job it is to understand the learning process.
Monitoring the Brain's Energy Consumption
To understand how some of the newer imaging techniques work, we need a little background information on the brain's use of energy. Your brain is the "greediest" organ in the body; the resting brain uses oxygen and glucose at 10 times the rate of the rest of the body. Thus, even though the brain makes up less than 2.5 percent of total body weight, it is responsible for 20 percent of the body's energy consumption. The major sources of energy for the brain are oxygen and glucose, which is a simple carbohydrate. When certain areas of the brain are active, cells in those areas have a greater need for glucose and oxygen. Scientists realized that if they could trace the flow and consumption of either of these substances in the brain, they could determine which areas were working the hardest and therefore were responsible for certain actions. In the 1970s, scientists began working to develop instruments that could construct an image of the brain by measuring the emissions given off as oxygen and glucose were consumed (Posner & Raichle, 1997). Positron emission tomography (PET) and magnetic resonance imaging (MRI) are two of the resulting brain-imaging methods.
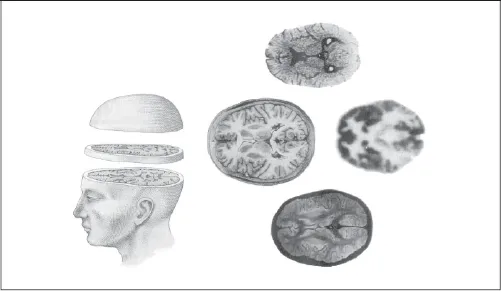
Figure 1.1 shows a comparison of three images of a slice of brain obtained by CAT, PET, and MRI. Starting at 9 o'clock in the figure and moving clockwise are images obtained with standard photography, X-ray CAT, PET (most often created in color), and MRI.
Figure 1.1. Imaging Techniques
From Gregory, R. (Ed.). (1987). The Oxford companion to the mind. New York: Oxford University Press, p. 348. Reproduced by permission of Oxford University Press.
Positron Emission Tomography (PET) Scan
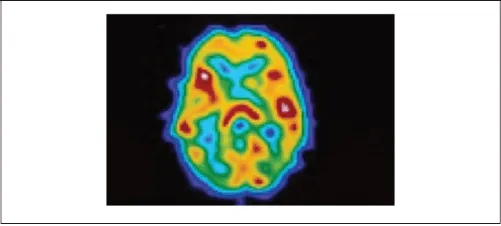
PET is one of the most exciting advances in brain imaging. This technique allows scientists to picture the general anatomical areas that become active while a person performs various mental tasks. The subject is injected with a small amount of radioactive glucose, which the blood carries to the brain. The subject is then placed in a PET scanner and asked to engage in a series of mental activities such as listening to words, saying words, or thinking about words. For example, a subject might be given a noun and asked to generate a verb that he or she associates with that noun. The brain areas responsible for these various activities will use much more of the radioactive glucose than other areas. When this happens, the radioactive material emits antimatter particles called positrons, which collide with the brain's electrons and produce gamma rays. These gamma rays travel through the skull and can be detected by sensors surrounding the head. From this information, a computer constructs colored images (tomographs). The areas of highest glucose use—and, therefore, of greatest activity—show up in white, red, and yellow, while areas of lesser use appear as green, blue, and purple (Posner & Raichle, 1997). Figure 1.2 is an example of a PET scan of a normal brain.
Figure 1.2. PET Scan
Courtesy of Phototake, Inc. Used with permission.
PET does have several drawbacks. Because it requires the injection of a radioactive tracer, PET is seldom used with children, and even an adult is generally allowed only one scanning session (usually 12 scans) a year. Another drawback is that neurons fire in milliseconds, but it requires about 40 seconds to obtain the data necessary to build an image of activity with PET. Therefore, how long an area remains active and the sequence of the activation of neural networks are not captured with this methodology. Finally, while a PET scan gives an excellent picture of overall activity in the brain, it does not show the specific area in which the activity is occurring.
Magnetic Resonance Imaging (MRI) Technology
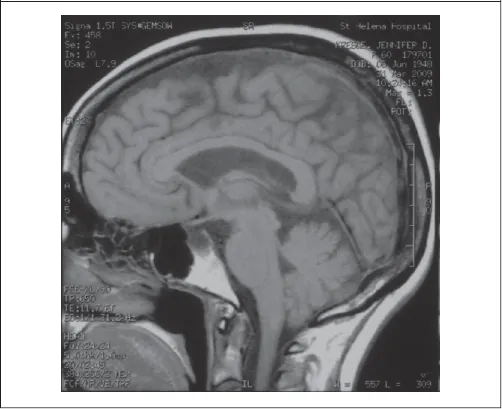
A large part of the human body is water, which is made of magnetically polarized molecules. An MRI takes advantage of the fact that the hydrogen atoms in the body's water can be made to behave like tiny magnets if they are placed in a strong magnetic field. A beam of radio waves fired from an MRI scanner will make the water molecules resonate and give off radio signals of their own. These waves are detected by sensors, and the information is then assembled into an image by a computer (Greenfield, 1997). The imaging of specific organs by this technique far surpasses the detail produced by CAT because the spatial resolution is much finer. In brain research, MRI is widely used to locate tumors and lesions or to identify other areas of abnormalities. Figure 1.3 is a typical MRI scan of a normal brain.
Figure 1.3. MRI Scan
Courtesy of Jennifer Kresge. Used with permission.
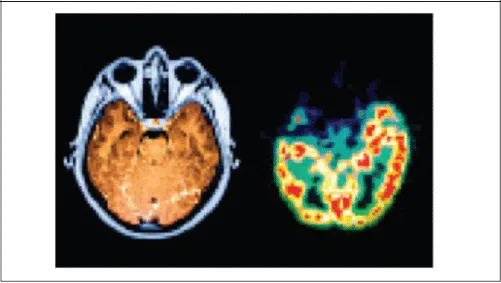
Figure 1.4 compares MRI and PET images of the same area of the brain. The MRI is on the left, and the PET scan is on the right.
Figure 1.4. Comparison of MRI and PET Scans
Courtesy of Phototake, Inc. Used with permission.
Functional Magnetic Resonance Imaging (fMRI) Technology
fMRI is one of the newest brain-imaging techniques to address some of the shortcomings of PET and MRI scans. The primary goal of fMRI is to show not only structures of the brain but also neural activity. First used in England in 1986, fMRI scanning in the United States has expanded over the past few years, partly because MRI scanners now are widely available and partly because they are much less expensive than PET scanners.
fMRI works much like a standard MRI. The subject is asked to engage in an activity such as tapping a finger or listening to a sound. The parts of the brain that are responsible for these activities will cause certain neurons to fire. These neural impulses require energy, so more blood flows to these regions. The oxygen in the blood changes the magnetic field so that the radio signal emitted becomes more intense. The fMRI scanner detects and measures these changes in intensity and produces a computer image. By subtracting this image from an image of the brain at rest, the computer produces a detailed picture of the brain activity responsible for moving a finger or listening to a sound.
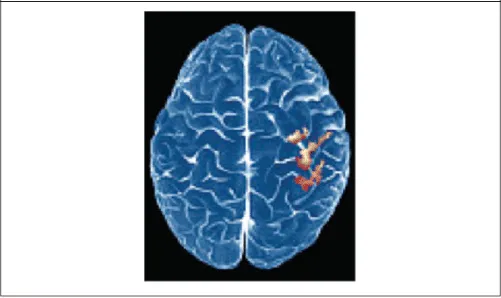
The scanner produces a rapid series of images, which results in a sort of brain activity "movie." The latest scanners can produce four images every second. The human brain reacts to a stimulus in about half a second, so the rapid scanning of fMRI can clearly show the ebb and flow of activity in various parts of the brain as it reacts to different stimuli or undertakes different tasks. A powerful fMRI can thus assemble a functional image of an entire brain in two to six seconds, compared with one minute for a PET scan. In addition, the fMRI can be repeated within seconds, while a PET takes nine minutes for the radiation to dissipate (Carter, 1998). fMRI is also less invasive than PET because it does not require the introduction of a radioactive substance into the body and can therefore be used with young children. Figure 1.5 is an fMRI scan of a normal brain showing motor activity of the left hand.
Figure 1.5. fMRI Scan
Courtesy of Phototake, Inc. Used with permission.
Electroencephalography (EEG)
Even though the speed of fMRI scanning is impressive, this technique cannot capture the much faster fluctuations in electrical activity that occur as neurons communicate with one another. In order to follow the moment-to-moment changes in neuronal activity, scientists must turn to other methods, such as EEG.
EEG is an imaging tool that has been in use for more than half a century. It measures electrical patterns created by the oscillations of neurons. On an ongoing basis, even during sleep, these electrical signals are constantly flashing throughout the brain. Body tissues conduct electricity well, so sensors placed on the scalp can detect impulses passing from the brain through the skull and the scalp. The electroencephalograph amplifies the signals and records them on a monitor or paper chart. You are probably familiar with the term brain waves, which is the name given to these various patterns of electrical activity.
Brain-wave frequency is measured by recording the number of cycles or oscillations per second. The more oscillations that occur per second, the higher the frequency of the wave. During wakefulness, the waves are small and fast and are called beta waves. Oscillations at this highest frequency occur during attention (beta I waves) and intense mental activity (beta II waves). Alpha waves oscillate a bit more slowly and occur when we close our eyes and relax. When we become drowsy and enter into light sleep, the waves slow down even more and are called theta waves. Entering into deep sleep produces large, slow waves known as delta waves.
Electroencephalography has provided a valuable tool for both researchers and clinicians, especially in the fields of epilepsy and sleep physiology, but it is also used in education-related issues such as language processing. Paula Tallal, language expert at Rutgers University, has used EEG along with MRI to determine that children with normal language skills have "lopsided" brains; that is, the left hemisphere is larger and more active than the right. This finding makes sense, as we know that in most people the left hemisphere specializes in language processing and the production of speech. Tallal has discovered, however, that children with language disorders often have ...