![]()
CHAPTER 1
Leveraging of Big Data from Manufacturing Facilities to Create New Business Insights
Gemma Braganza
ABSTRACT
Standardizing the capture of manufacturing data can enable meaningful data visualization to occur. Once fully realised, the capability envisaged in this project the ‘Data Vault’ will link multiple manufacturing systems from global production facilities to enable performance comparisons, cost optimization, and performance models to enable meaningful business insights in a set of user-defined dashboards.
1. INTRODUCTION
Proctor and Gamble (P&G) owns multiple hair care plants around the world, each producing thousands of tonnes of conditioner per year. The conditioner is produced via a process that generates unique manufacturing data for each production lot. This manufacturing data is often assessed by lot, to confirm that the conditioner was made as intended, and complies to the requirements of the formula recipe. Currently, the millions of data points captured via the manufacturing systems are assessed on an individual production lot basis, with occasional manual compilation to compare across multiple production lots.
In funding the Data Vault project, P&G has committed to enabling a significant improvement in how this data which is captured, collated and compared. This will enable greater business insights into manufacturing processes, and enable performance and cost optimization from the interpretation of collated, structured, visualised and modelled data.
2. PROBLEM STATEMENT
The creation of the Data Vault will enable new business insights into the data related to the production of conditioner. Several aspects of the data project are being completed in parallel to ensure that the end user can visualise and interpret data. Key considerations include: the structure of captured data, the frequency of extraction, optimal local and global storage, and the creation of any calculated fields until the dashboards are executed.
3. STATE OF THE ART
The Data Vault project involves the collaboration of a multi-functional, multi company, global team to deliver an end-to-end data system. Ensuring a seamless communication between the needs of the end user to the design and construction of the database is key to the success and timely delivery of this project.
Specifically for the visualisation, Tableau has been utilised to build prototypes to enable effective communication of possibilities to the end user, and requirements to the external vendor.
To deliver the required visualisation and business insight, the structure and efficiency of the database has been considered and defined. Calculated fields, which either consist of logical or mathematical calculations, have been envisioned and defined.
4. SOLUTION: DESCRIPTION OF APPROACH
The Data Vault project is designed to bring the conditioner manufacturing data from global manufacturing facilities into one standardised structure, and enable a centralised database whereby users can visualise, analyse and optimise the conditioner-making process.
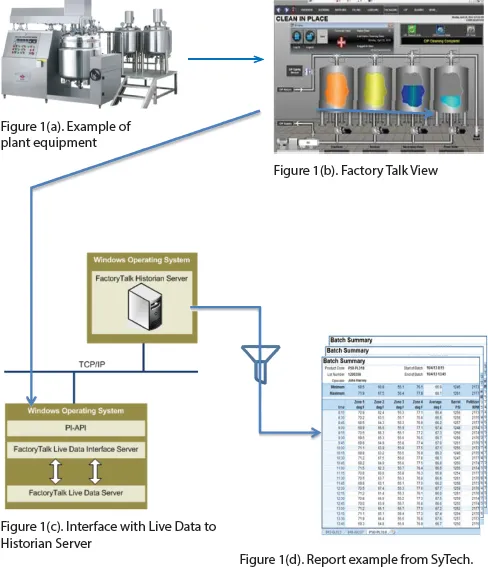
The current structure of the data flow from equipment to the end user reports is visualised below. Data is captured from the manufacturing equipment and visualised in real time via Factory Talk software. Data captured from multiple sensors on the equipment is passed through the FactoryTalk Server to the Historian Server where it is stored. The manufacturing plant can subsequently generate reports based on specific requirements, with data filtered to individual needs.
This structure allows for individual reporting at each manufacturing location, for an individual production lot process. The reporting is sufficiently granular to enable analysis of the process for a specific lot; it can hence provide confirmation that the lot was made according to the required process (Figure 1).
To develop any further analysis, such as performance of the processes across multiple production or plants, requires further data analysis and manipulation. Currently, such analysis would typically include basic charting of process parameters, with the interim step required of importing, collating and cleaning the data to make visual comparisons. Further statistical analysis and modelling of the process parameters to enable optimization or predictive capabilities requires significant time input and data manipulation, which is rarely undertaken. A previous attempt at this type of analysis compared in-process measures to final product properties to try and establish the driver behind product that did not conform to consumer requirements. To enable the work to be done with available resource and within a required time frame, a sample of production lots was taken (approximately 5 per cent of available data) at the extreme ends of the product property measure, and approximately 10 per cent of the process parameters were assessed to determine a relationship between the two. Clearly, if it were easier to access, collate, visualise and analyse data on a larger scale, then it would be more likely to determine any relationship that may exist between process parameter and product properties.
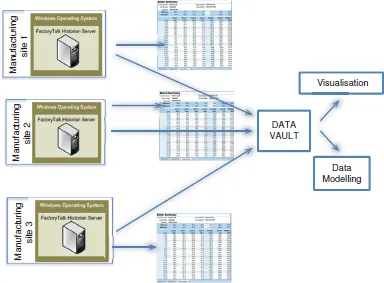
The Data Vault project aims to bridge this gap and enable cross plant or cross lot analysis to occur in a standardised way. The following shows the overall structure of data storage and flow (Figure 2):
4.1. Work flow
The Historian database, Data Vault Database and visualization design are all being developed in parallel. This is to enable feedback from the end user to be right across the data flow to ensure that data needed by the end user to make business insights is captured in the Historian database.
Figure 1: Production process data.
4.2. Historian database standardisation
The Historian has several advantages that are being utlised across this project:
Figure 2: Data storage and flow.
•Define tags and displays that are standard across different manufacturing sites
•Share data and integrate seamlessly with other systems
•Configurable from anywhere on the network; access stored data remotely
•Scalable Architecture from single station HMI to multi-client/multi-server system [4]
By implementing a standardised data structure, data from all sites can be leveraged. There are several attributes that have been defined to ensure the needs of the end user have been met:
•All required tags are captured in the database
During the development of the project, several tags (e.g. status of equipment, measurements from sensors) were added to the tables of data held in the Historian.
The frequency of data captured has been defined. This depends on the level of granularity that is needed by the end user, and in how much detail comparisons need to be made.
The structure of the data within the Historian has been modified to meet the needs of Data Vault. The initial structure involved the use of stored procedures to generate end user reports. This meant that
for current reports, as each user requested them via the Historian interface, the data tables were searched and the report populated. The use of stored procedures for use in data vault was not a viable option for the following reasons:
–By using stored procedures to generate reports, the “primary data” is not stored in Historian (i.e. the data in the form at which it is originally observed). Historian is required to hold the original reported data rather than the vault server which does not meet company requirements for Quality Assurance and data security.
–By using stored data to generate reports, the risk of having a slow system emerges as these reports are generated to populate vault, rather than having collated data held in the right format within vault.
–As updates occur with the data structure in the Historian, updates would not automatically occur in any stored procedures if operated from the Vault; this could lead to poor data quality/ errors in the Vault. By keeping all data tables stored in the required format within the Historian, any updates and changes are made to the original data structure and are less likely to cause on-going upkeep needs for the Vault.
The work flow for the Historian database definition is finished in the early stages of the Data Vault project, since much of the structure already exists in the manufacturing facilities. The changes and requirements need to be defined early on in the project, and are then fed into the Data Vault database design implementation.
4.3. Data vault database
The Data Vault will store all required data for visualization in one place from each of the manufacturing sites and units in a structured form. During the work process, a full list of fields that must be pulled from the Historian is defined, as well as fields that must be calculated within the database. The definition of calculated fields will be discussed further below.
The work flow for the Data Vault datab...