eBook - ePub
Medical Statistics from Scratch
An Introduction for Health Professionals
David Bowers
This is a test
Compartir libro
- English
- ePUB (apto para móviles)
- Disponible en iOS y Android
eBook - ePub
Medical Statistics from Scratch
An Introduction for Health Professionals
David Bowers
Detalles del libro
Vista previa del libro
Índice
Citas
Información del libro
Correctly understanding and using medical statistics is a key skill for all medical students and health professionals. In an informal and friendly style, Medical Statistics from Scratch provides a practical foundation for everyone whose first interest is probably not medical statistics. Keeping the level of mathematics to a minimum, it clearly illustrates statistical concepts and practice with numerous real-world examples and cases drawn from current medical literature.
Medical Statistics from Scratch is an ideal learning partner for all medical students and health professionals needing an accessible introduction, or a friendly refresher, to the fundamentals of medical statistics.
Preguntas frecuentes
¿Cómo cancelo mi suscripción?
¿Cómo descargo los libros?
Por el momento, todos nuestros libros ePub adaptables a dispositivos móviles se pueden descargar a través de la aplicación. La mayor parte de nuestros PDF también se puede descargar y ya estamos trabajando para que el resto también sea descargable. Obtén más información aquí.
¿En qué se diferencian los planes de precios?
Ambos planes te permiten acceder por completo a la biblioteca y a todas las funciones de Perlego. Las únicas diferencias son el precio y el período de suscripción: con el plan anual ahorrarás en torno a un 30 % en comparación con 12 meses de un plan mensual.
¿Qué es Perlego?
Somos un servicio de suscripción de libros de texto en línea que te permite acceder a toda una biblioteca en línea por menos de lo que cuesta un libro al mes. Con más de un millón de libros sobre más de 1000 categorías, ¡tenemos todo lo que necesitas! Obtén más información aquí.
¿Perlego ofrece la función de texto a voz?
Busca el símbolo de lectura en voz alta en tu próximo libro para ver si puedes escucharlo. La herramienta de lectura en voz alta lee el texto en voz alta por ti, resaltando el texto a medida que se lee. Puedes pausarla, acelerarla y ralentizarla. Obtén más información aquí.
¿Es Medical Statistics from Scratch un PDF/ePUB en línea?
Sí, puedes acceder a Medical Statistics from Scratch de David Bowers en formato PDF o ePUB, así como a otros libros populares de Médecine y Biostatistiques. Tenemos más de un millón de libros disponibles en nuestro catálogo para que explores.
Información
II
Descriptive Statistics
2
Describing data with tables
Learning objectives
When you have read this chapter, you should be able to:
- Explain what a frequency distribution is.
- Construct a frequency table from raw data.
- Construct relative frequency, cumulative frequency, and relative cumulative frequency tables.
- Construct grouped frequency tables.
- Construct a cross‐tabulation table.
- Explain what a contingency table is.
- Rank data.
Descriptive statistics. What can we do with raw data?
As we saw in Chapter 1, when we have a lot of raw data, for example, as in Figure 1.1 (birthweight) or Figure 1.2 (gender), it is not easy for us to answer questions that we may have; for example, the percentage of low birthweight babies or the proportion of male babies. This is because the data have not been arranged or structured in any way. If there are any interesting features in the data, they remain hidden from us. We said then that the data could not tell their story, and of course, the more data there are, the harder this becomes. Samples of many hundreds or thousands are not uncommon.
In this chapter, and the four following, we are going to describe some methods for organising and presenting the data, so that we can answer more easily the questions of interest – essentially to enable us to see what’s going on. Collectively, these methods are called descriptive statistics. They are a set of procedures that we can apply to raw data, so that its principal characteristics and main features are revealed. This might include sorting the data by size, putting it into a table, presenting it as a chart, or summarising it numerically.
An important consideration in this process is the type of data you are working with. Some types of data are best described with a table, some with a chart and some perhaps with both, whereas with other types of data, a numeric summary might be more appropriate. In this chapter, we focus on organising raw data into what is known as a frequency table. In subsequent chapters, we will look at the use of charts, and numeric summaries. It will be easier if we take each data type in turn, starting with nominal data.

Frequency tables – nominal data
We have already seen a rudimentary frequency table in Chapter 1, with a count of male and female babies from Figure 1.2.
| Male | 56 |
| Female | 44 |
We can express this information in the more conventional form of a frequency table, as in Figure 2.1.
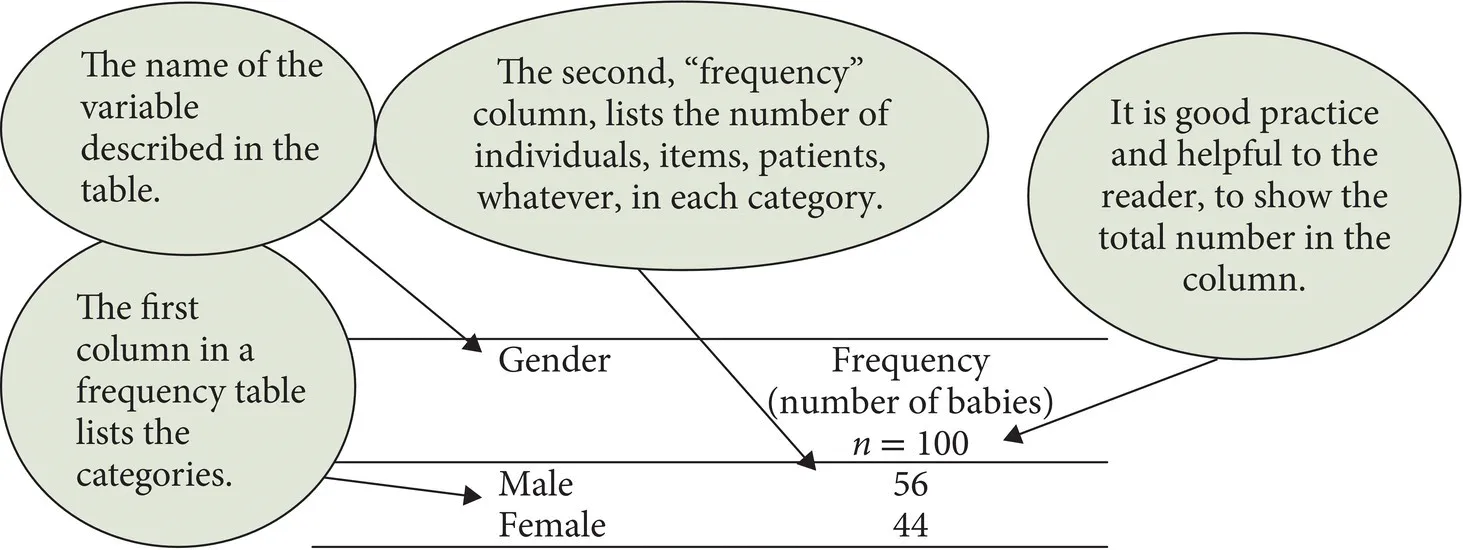
Figure 2.1 A frequency table for gender of newborn babies (raw data from Figure 1.2).
The label at the top of the first (left‐hand) column indicates the variable being described in the table. The remainder of the first column is a list of the categories for this variable. The second (right‐hand) column is the frequency column. Frequency is another word for “count,” and lists in this example, the number of babies in each category, that is, Males and Females.
Exercise 2.1. Using the raw data from Figure 1.3, construct a frequency table for the number of women who smoked while pregnant. Does it matter how you order the categories in the first column?
The frequency distribution
Consider another example. Figure 1.9 contains data from a nit lotion study that compared two types of treatment for nits, malathion or d‐phenothrin, with a sample of 95 children. For each child, data were collected on nine variables, one being the child’s hair colour: blonde, brown, red, and dark. The frequency table (extracted from Figure 1.9) for the four colour categories...