eBook - ePub
Statistical Techniques in Geographical Analysis
Dennis Wheeler,Gareth Shaw,Stewart Barr
This is a test
- 354 páginas
- English
- ePUB (apto para móviles)
- Disponible en iOS y Android
eBook - ePub
Statistical Techniques in Geographical Analysis
Dennis Wheeler,Gareth Shaw,Stewart Barr
Detalles del libro
Vista previa del libro
Índice
Citas
Información del libro
This volume includes changes in the switch from DOS-based to Windows-based, menu-driven forms of SPSS and MINITAB is the most important. The other change shows availability of data in digital form from websites or via CD-ROMs. The book is useful for teachers and students.
Preguntas frecuentes
¿Cómo cancelo mi suscripción?
¿Cómo descargo los libros?
Por el momento, todos nuestros libros ePub adaptables a dispositivos móviles se pueden descargar a través de la aplicación. La mayor parte de nuestros PDF también se puede descargar y ya estamos trabajando para que el resto también sea descargable. Obtén más información aquí.
¿En qué se diferencian los planes de precios?
Ambos planes te permiten acceder por completo a la biblioteca y a todas las funciones de Perlego. Las únicas diferencias son el precio y el período de suscripción: con el plan anual ahorrarás en torno a un 30 % en comparación con 12 meses de un plan mensual.
¿Qué es Perlego?
Somos un servicio de suscripción de libros de texto en línea que te permite acceder a toda una biblioteca en línea por menos de lo que cuesta un libro al mes. Con más de un millón de libros sobre más de 1000 categorías, ¡tenemos todo lo que necesitas! Obtén más información aquí.
¿Perlego ofrece la función de texto a voz?
Busca el símbolo de lectura en voz alta en tu próximo libro para ver si puedes escucharlo. La herramienta de lectura en voz alta lee el texto en voz alta por ti, resaltando el texto a medida que se lee. Puedes pausarla, acelerarla y ralentizarla. Obtén más información aquí.
¿Es Statistical Techniques in Geographical Analysis un PDF/ePUB en línea?
Sí, puedes acceder a Statistical Techniques in Geographical Analysis de Dennis Wheeler,Gareth Shaw,Stewart Barr en formato PDF o ePUB, así como a otros libros populares de Education y Education General. Tenemos más de un millón de libros disponibles en nuestro catálogo para que explores.
Información
Chapter 1
Introduction
1.1 Introduction
STATISTICAL METHODS ARE NOW an accepted, indeed expected, part of a geographer’s training, and most higher education programmes will include some elements of this important area of study. Regrettably, for many students this can be a painful and sometimes unrewarding encounter. Problems may arise from a lack of any comprehensive background in numerical analysis; a problem too often compounded by a seemingly bewildering notational system of unfamiliar Greek symbols. Further problems arise from the disillusion that many undergraduates find when courses and texts venture no further than univariate or bivariate methods, yet it is all too apparent that many geographical issues are multivariate in character, with the result that statistical training may not match geographical insight or analytical ambition.
These difficulties are not new, and have been recognised by a generation of geography teachers. Efforts to overcome them have met with mixed success, and over the last ten years or so another element has entered the equation. Widely available and powerful statistics software offer undoubted advantages, but must be used with caution, and make yet more, and not less, apparent the need to coach students in the theory and understanding of statistical methods. The temptation to use highly sophisticated and perhaps inappropriate techniques on indiscriminately large data sets is a regrettable consequence of the electronic age, but one that needs to be resisted. The value of any computational exercise is wholly undermined if the user has an uncertain grasp of the data requirements, principles and possible pitfalls of their chosen method of analysis.
With this background in mind, the authors have designed a book that embraces three themes. The first of these is the statistical methods themselves, the second is their application using computational software, and the third is the identification of data sources and management of those data. We draw these strands together by introducing a wide range of statistical procedures, each amplified by worked examples using the MINITAB and SPSS (Statistics Package for the Social Sciences) systems. It was decided to adopt both systems as in doing so we included the packages used by over 70 per cent of university geography departments. The range of methods covered should be sufficiently varied to satisfy the needs of an even greater proportion of undergraduate and postgraduate students and their teachers. In any such text, however, only a selection of a truly vast array of methods can be covered. In this the authors were guided principally by an examination of the methods most widely used in published geographical research works. We cannot, and have not attempted to, replicate the encyclopaedic statistics manuals of which S. Siegal’s (1956) Nonparametric Statistics for the Behavioral Sciences is such a splendid example. Neither have we attempted to embrace the full range of options and alternatives in the SPSS and MINITAB systems. Again we have offered what is likely to be most necessary for students at undergraduate and early postgraduate level. Here, however, the excellent ‘on-line’ Help Guides of both systems could, and should, be consulted where there are any doubts or the reader wishes to investigate in greater depth what these two remarkable software packages have to offer.
The CD-ROM that comes with this book contains data files in MINITAB and SPSS formats for the worked examples, and provides ample opportunity to practise immediately with the methods as they are introduced. Although similar in so many respects, SPSS and MINITAB differ in the way in which test results are presented and in the range of output statistics that are available. These differences become more marked as this text progresses to the more sophisticated procedures. In all cases we have attempted to provide the alternative with which students are likely to be most at ease. Only occasionally can we provide text-based examples of the application of both systems to one method. In those many cases where MINITAB or SPSS have been used alone, the CD that accompanies the text will provide examples of the alternative system’s procedures, using screen displays and some text. By this means those with access to only one of SPSS or MINITAB will not be at a disadvantage. Almost all the methods introduced can be executed in either SPSS or MINITAB. There are, however, a small number that cannot be performed by the standard software, and one or two that are not available on older versions.
The layout of the book is deliberately progressive, from the simpler to the more advanced methods and from the univariate and descriptive to the multivariate, more analytical approach. The chapters should not, however, be seen in isolation. We have tried to emphasise the continuity as one progresses from one theme to another, and to strike a balance between indispensable theory and necessary practice. Many geography students enrol on a degree programme without having pursued the study of mathematics beyond the age of 15 or 16 and approach statistics with some apprehension. With this problem foreseen, we have included a chapter that reviews the more common algebraic and mathematical principles with which the user should be familiar. As with the statistical procedures, it is not intended to be an exhaustive review, but covers the essential points from which students can move on with greater confidence. Because of the near-universal reliance on software packages, it might be thought that such arithmetic knowledge would serve little purpose. This is not the case, and it remains fundamental if the execution of the techniques is to be correctly undertaken, and the results understood! Indeed, students are often surprised to find that the level of mathematical competence required to perform manually some of the statistical analysis is not demanding. Addition, subtraction, multiplication, division and the use of squares, square roots and logarithms meet most needs. Statistics is, however, characterised by the repetitive nature of the arithmetic, with long columns of numbers to be treated. Although tedious to the researcher, this of course, is the great virtue of electronic computers, which can perform these simple tasks with imagination-defying speed. Nevertheless, it is valuable for students to perform some of the simpler statistical procedures manually, and the inclusion of details of software applications must not be taken as an invitation for their use in all cases.
The authors have assumed that students are generally familiar with the MS Windows operating system, and we have concentrated on the specific requirements of the two software systems, both of which are used in their most recent Windows-based versions. Inevitably therefore, some sections are devoted to the more mechanical tasks of running the software but, even here, we need to know the nature of the methods in order that appropriate options can be chosen from the wide range presented by the programs. Use is made wherever possible of screen images to show how the instructions are given to the computer. These were prepared using MINITAB v.14 and SPSS v.11, but they apply to the most recent Windows-generation versions of these two systems.
The question of data collection and gathering has also been considered. The growing availability of on-line data sources, of downloadable files and CD-ROMs has prompted a veritable revolution in this field. Most certainly, some areas of geography are better served than others in this respect, but we have drawn attention to the more important of the UK-base websites. Again, however, the list is not fully comprehensive, neither can it be in an area that is developing as quickly as this one.
As far as it can be, this book is designed therefore to be a self-contained guide that gives methodological instruction, offers guidance with computational procedures and directs geographers to data sources. In respect of theory and practice, and of the range of methods and their applications we hope that we have struck a helpful balance that encourages and does not daunt the reader.
1.2 The CD-ROM
The inclusion of the CD is designed to complement and not replace the textbook. It includes additional guidance notes in PDF format, together with copies of all the data files used in the worked examples. Much can be learned from simply investigating the system with different instructions and utilising different options. With this in mind, one particularly large data file, which covers observations for 35 socio-economic variables for the 46 English counties has been included. Only a few of its constituent variables have been used, mostly in Chapters 9 and 10, and students and teachers are invited to investigate this data set and the software at their leisure.
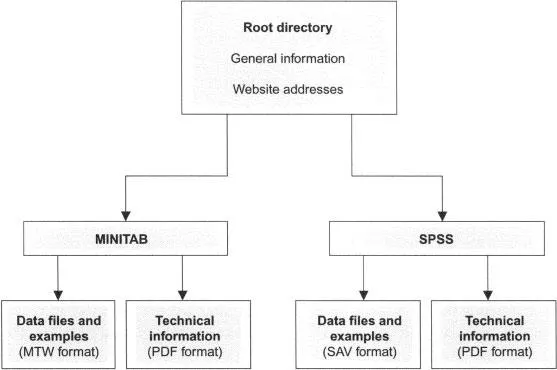
Each data file is set up in both MINITAB and SPSS formats so that they can be called up directly into the appropriate system with further manipulation. The reader will see that the root directory of the CD is partitioned into MINITAB and SPSS subdirectories for just this purpose (Figure 1.1). Also included under the different techniques headings are PDF files with additional worked examples in both systems to cover those many cases where text limitation prevent duplication of procedures using both MINITAB and SPSS. These PDF files require Adobe Acrobat reader, and this software can be downloaded free of charge from the website whose URL is given in the root directory of the CD. You need only click on the address for the connection to be made through the world wide web (www).
The root directory also provides the URLs of the various website sources that are used in the text. This list is, it must be noted, highly selective, and it is not offered as a comprehensive review of all such sources.
1.3 Conventions and Layout
In order to facilitate use of the book, we have adopted a number of conventions and approaches to the layout of the text. Wherever possible, screen displays of examples are used to guide the reader. Limitations on space prevent, however, every stage from being illustrated in this fashion, although the CD provides more scope for this aspect of the presentation. A number of conventions have also been adopted to make the text easier to follow:
- Bold text items: many references are made to key words and button names on the pull down menus and in the dialogue boxes. To highlight their importance and clarify the text all such instructional items are printed in bold. Where successive instructions are required these are indicated by use of the > symbol. For example, to open an existing MINITAB data file, the instructions would be indicated thus: File > Open Worksheet. The first item is the header on the pull down menu, and the second is the required option from the list presented. In many cases there will be longer sequences of options. Such commands usually produce a dialogue box. If specific buttons in the dialogue boxes such as OK, Continue, Options etc. are required to be clicked, they are similarly printed in bold.
- Italicised text items: where specific technical terms are used that are not part of the software’s command or instructional vocabulary, they are printed in italics on their first appearance in the text, but thereafter in Roman form.
- UPPER CASE TEXT ITEMS: where reference is made to data files written on the CD, the file names are given in upper case, non-bold, text. The file formats, e.g. SAV or MTW are also in upper case.
Chapter 2
An Introduction to Mathematical Statistics and Computer Applications
2.1 Introduction
THE AIM OF THIS chapter is not to educate the reader in all or even many of the branches of mathematics or aspects of computing, but rather to provide a brief introduction to the arithmetic and computational procedures used in the following chapters. We have assumed a basic level of numeracy, and a general familiarity with the MS Windows’ operating system, but nothing more than this. Those who have pursued a course in mathematics at ‛A’ level or equivalent grades elsewhere may feel confident in skipping the first six sections of this chapter, though all would benefit from the introductory sections that describe the two statistics packages adopted in this book for the execution of the analytical methods described in the following chapters.
Geography students, many of whom embark on their degree levels studies with a generally ‛arts’ background, are rarely at ease when handling quantitative data, the successful analysis of which is not so much a question of mathematical ability as of confidence and clear thinking. All too often students allow themselves to be intimidated by the vocabulary and algebraic shorthand of statistical methods, and some do not recover from the trauma of their initial encounters with this important branch of their chosen discipline. This need not be the case. In reality many of the equations used by statisticians are surprisingly simple, and involve only the irksome repetition of the basic arithmetic procedures of addition, subtraction, multiplication or division. Only rarely do they provide challenging mathematical enterprises. Perhaps if is the abundant use of Greek symbols or the wealth of subscripts that prompts uncertainty in the min...
Índice
- Cover
- Half Title
- Title Page
- Copyright
- Contents
- Preface to the third edition
- Acknowledgements
- Chapter 1. Introduction
- Chapter 2. An introduction to mathematical statistics and computer applications
- Chapter 3. Geographical sources, data collection and data handling
- Chapter 4. Measurement and descriptive statistics
- Chapter 5. Probability and probability distributions
- Chapter 6. Samples and populations
- Chapter 7. Testing hypotheses using parametric and non-parametric data
- Chapter 8. Methods of correlation analysis
- Chapter 9. Simple linear and non-linear regression
- Chapter 10. Multiple regression and correlation
- Chapter 11. Factor analysis and related techniques
- Chapter 12. Cluster analysis
- Chapter 13. Spatial indices and pattern analysis
- Appendices
- References
- Index
Estilos de citas para Statistical Techniques in Geographical Analysis
APA 6 Citation
Wheeler, D., Shaw, G., & Barr, S. (2013). Statistical Techniques in Geographical Analysis (3rd ed.). Taylor and Francis. Retrieved from https://www.perlego.com/book/1609135/statistical-techniques-in-geographical-analysis-pdf (Original work published 2013)
Chicago Citation
Wheeler, Dennis, Gareth Shaw, and Stewart Barr. (2013) 2013. Statistical Techniques in Geographical Analysis. 3rd ed. Taylor and Francis. https://www.perlego.com/book/1609135/statistical-techniques-in-geographical-analysis-pdf.
Harvard Citation
Wheeler, D., Shaw, G. and Barr, S. (2013) Statistical Techniques in Geographical Analysis. 3rd edn. Taylor and Francis. Available at: https://www.perlego.com/book/1609135/statistical-techniques-in-geographical-analysis-pdf (Accessed: 14 October 2022).
MLA 7 Citation
Wheeler, Dennis, Gareth Shaw, and Stewart Barr. Statistical Techniques in Geographical Analysis. 3rd ed. Taylor and Francis, 2013. Web. 14 Oct. 2022.