eBook - ePub
Brain Mapping: The Methods
Arthur W. Toga,John C. Mazziotta
This is a test
- 877 páginas
- English
- ePUB (apto para móviles)
- Disponible en iOS y Android
eBook - ePub
Brain Mapping: The Methods
Arthur W. Toga,John C. Mazziotta
Detalles del libro
Vista previa del libro
Índice
Citas
Información del libro
Investigation of the functional architecture of the human brain using modern noninvasive imaging techniques is a rapidly expanding area of research. A proper knowledge of methodology is needed to appreciate the burgeoning literature in the field. This timely publication provides an excellent catalogue of the main techniques.
The authors offer an invaluable analysis of mapping strategies and techniques, providing everything from the foundations to the major pitfalls and practical applications of the modern techniques used in neuroimaging. Contains over 1000 full color pages with more than 200 color figures.
Spanning the methodological gamut from the molecular level to the whole brain while discussing anatomy, physiology, and pathology, as well as their integration, Brain Mapping: The Methods, Second Edition, brings the reader a comprehensive, well-illustrated and entirely readable description of the methods for brain mapping. Drs. Toga and Mazziotta provide everything from the foundations to the major pitfalls and practical applications of the technique by assembling an impressive group of experts, all widely known in their field, who contribute an outstanding set of chapters.
Preguntas frecuentes
¿Cómo cancelo mi suscripción?
¿Cómo descargo los libros?
Por el momento, todos nuestros libros ePub adaptables a dispositivos móviles se pueden descargar a través de la aplicación. La mayor parte de nuestros PDF también se puede descargar y ya estamos trabajando para que el resto también sea descargable. Obtén más información aquí.
¿En qué se diferencian los planes de precios?
Ambos planes te permiten acceder por completo a la biblioteca y a todas las funciones de Perlego. Las únicas diferencias son el precio y el período de suscripción: con el plan anual ahorrarás en torno a un 30 % en comparación con 12 meses de un plan mensual.
¿Qué es Perlego?
Somos un servicio de suscripción de libros de texto en línea que te permite acceder a toda una biblioteca en línea por menos de lo que cuesta un libro al mes. Con más de un millón de libros sobre más de 1000 categorías, ¡tenemos todo lo que necesitas! Obtén más información aquí.
¿Perlego ofrece la función de texto a voz?
Busca el símbolo de lectura en voz alta en tu próximo libro para ver si puedes escucharlo. La herramienta de lectura en voz alta lee el texto en voz alta por ti, resaltando el texto a medida que se lee. Puedes pausarla, acelerarla y ralentizarla. Obtén más información aquí.
¿Es Brain Mapping: The Methods un PDF/ePUB en línea?
Sí, puedes acceder a Brain Mapping: The Methods de Arthur W. Toga,John C. Mazziotta en formato PDF o ePUB, así como a otros libros populares de Biowissenschaften y Neurowissenschaft. Tenemos más de un millón de libros disponibles en nuestro catálogo para que explores.
Información
III
Tomographic-Based Data Acquisition
12
High-Field Magnetic Resonance
Kamil Ugurbil, Center for Magnetic Resonance Research, University of Minnesota Medical School, Minneapolis, Minnesota 55455
I. Introduction
II. Signal-to-Noise Ratio
III. Functional Brain Imaging
IV. Spectroscopy at High Magnetic Fields
References
I. Introduction
The history of Nuclear Magnetic Resonance (NMR) is marked by ever increasing number of innovations that have produced novel and surprising uses of this phenomenon for investigating biological processes. No other technique has proven to be so uniquely flexible and dynamic. Since its introduction over fifty years ago [79–81], NMR rapidly evolved to become an indispensable tool in chemical and biochemical research because of its sensitivity to the chemical environment of nuclear spins. In 1973, ability to obtain images with magnetic resonance was introduced [54], leading to the development of magnetic resonance imaging (MRI), which is now solidly established as a research tool and as a non-invasive diagnostic technique in the practice of medicine.
In biochemical and chemical applications of the nuclear magnetic resonance phenomenon, the quest for ever increasing magnetic fields has been and continues to be pursued without hesitation, resulting in a flurry of activity focused at developing instruments operating at higher and higher field strengths. This enthusiasm for higher fields, however, has not been prevalent in the field of human imaging, until perhaps a few years ago. In stark contrast to molecular NMR, it was commonly assumed that higher magnetic fields are detrimental to MR imaging of the human body. This assumption was not based on the existence of any experimental evidence; rather, it followed from concepts and theoretical considerations regarding the interaction of high frequency electromagnetic waves with the conductive human body, leading to the suggestion that human imaging may not be possible beyond 10 MHz (∼0.24 Tesla) [40]. Of course, even clinical imaging is now performed mostly at 1.5 T (∼63 MHz), and recent work at 3 to 8 Tesla has demonstrated that exquisite anatomical imaging of the human head is achievable at these high fields (e.g. [1, 10, 74, 95, 97] and references therein).
In our laboratory, the effort to pursue high magnetic fields was intricately tied to our interest in developing methods for the acquisition of physiological and biochemical information non-invasively using the nuclear spins of the water molecules and metabolites in the human body. In this effort, a relatively recent and unique accomplishment has been the introduction of the ability to map human brain function non-invasively. The work that lead to the introduction of this methodology from our group [71] (together with concurrent and independent work from MGH [53]) was conducted at 4 Tesla. Today, functional images with sub-centimeter resolution of the entire human brain can be generated in single subjects and in data acquisitions times of several minutes using 1.5 Tesla MRI scanners that are often employed in hospitals for clinical diagnosis. However, there have been accomplishments beyond this type of functional imaging using significantly higher magnetic fields such as 4 Tesla, and recently 7 Tesla in humans, and 9.4 Tesla in animal models. In this chapter, data and concepts relevant to high magnetic fields are reviewed, with the primary focus on efforts related to probing brain function and neurochemistry utilizing imaging and spectroscopy capabilities.
II. Signal-to-Noise Ratio
In all NMR experiments, and especially in in vivo applications, gains in signal-to-noise ratio (SNR) are the key to extending the applications of this phenomenon to new frontiers in research. This is well recognized for studies of macromolecules and for in vivo spectroscopy where intracellular compounds with submillimolar concentrations are currently observable with difficulty, and the vast majority of intracellular compounds are beyond NMR’s reach. SNR limitations, however, are also paramount in demanding functional and physiological studies.
SNR gains can be achieved in going to higher fields. SNR, however, becomes rather complex when high magnetic field (hence high frequencies) are considered with lossy biological samples such as the human body and the human head. The relationship between SNR and resonance frequency, ω, or equivalently field strength has been examined for biological samples in numerous studies [40–42,102], predicting increases with field strength. At high frequencies such as 170 MHz (1H frequency for 4 Tesla) and above, SNR must be considered as a function of location within a sample and for particular sample geometries. SNR gains with increasing fields have been predicted for the interior of a sphere approximating the size and electromagnetic properties of the human head [41, 98, 99]. Such gains were calculated to be linear up to 200 MHz, and steeper than linear above 200 MHz (1H frequency for 4.7 Tesla) [45].
Field dependence of SNR was experimentally examined by our group in the human head, initially comparing 0.5, 1.5 and 4 Tesla (∼21, 64, and 170 MHz, respectively), using a surface coil, documenting that SNR for the 1H nucleus increased at least linearly at the higher frequencies [28]. More recently, with the availability of a 7 Tesla human system in our laboratory, we examined and compared the B1 field profile and SNR in the human head for 4 and 7 Tesla when using a TEM “volume” head coil [97]. It was expected that a coil with a uniform B1 field profile when empty will nonetheless lead to a highly non-uniform B1, SNR, and power deposition over the human head and brain. The B1 distribution was mapped over the human head using magnetization preparation followed by ultrafast imaging (“turboFlash”). Magnetization preparation was accomplished with a variable-duration hard (square) pulse followed by rapid gradient spoiling to eliminate transverse magnetization. The resultant longitudinal magnetization is directly proportional to {cos(τγB1)} where τ and γ are the pulse duration and gyromagnetic ratio, respectively. In such an experiment, as τ is incremented over a period that exceeds (1/γβ1), the signal intensity oscillates with the frequency γβ1. While the signal amplitude over the image will be affected by variations in B1 magnitude and the T1 relaxation affects that may come into play in the ultrafast image acquisition, the frequency of signal oscillation will be a function of B1 only. The results demonstrated that the signal intensity oscillates with higher frequency in the brain center than in the periphery at both field strengths but much more so at 7 Tesla (Figure 1). At 4 T, the B1 strength in the brain periphery was down 23% from the center value. At 7 T, the peripheral B1 was 42% lower than the central B1. The non-uniform B1 profiles obtained experimentally were both expected and predicted by the Maxwell models of the human head loaded TEM coil [97].
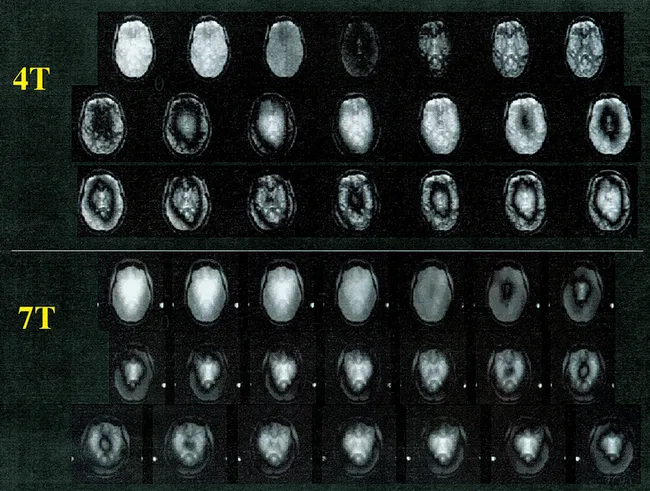
Figure 1A Images of a transverse slice through the human head at 7 Tesla, obtained with magnetization preparation to encode B1 magnitude as {cos (tgB1)} and imaging it rapidly using “turboFlash” (center-out k-space sampling, TR/TE = 4.2 ms/2.5 ms, slice thickness = 5 mm, flip angle = 10° at the slice center, matrix size = 128 × 64). The different images correspond to different t while B1 magnitude was kept constant.
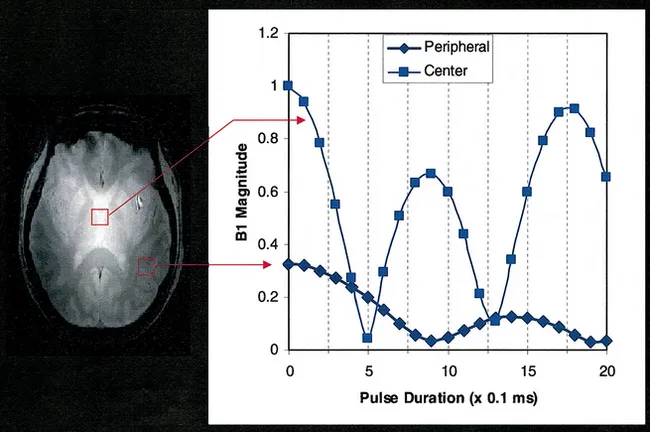
Figure 1B The signal (magnitude) oscillation frequency plotted for two regions of interest in the middle and the periphery of the brain, from the data shown in figure 1A. Oscillation frequency is equal to gB1 indicating that the B1 is substantially higher in the center of the brain. From reference [97].
Inhomogeneities in the B1 distribution within a human head when using a “volume” coil that normally generates a homogeneous RF field implies that SNR must also be me...
Índice
- Cover image
- Title page
- Table of Contents
- Copyright
- Contributors
- Preface
- Acknowledgments
- I: Introduction
- II: Surface-Based Data Acquisition
- III: Tomographic-Based Data Acquisition
- IV: Postmortem
- V: Analysis
- VI: Databases and Atlases
- VII: Emerging Concepts
- Index
Estilos de citas para Brain Mapping: The Methods
APA 6 Citation
Toga, A., & Mazziotta, J. (2002). Brain Mapping: The Methods (2nd ed.). Elsevier Science. Retrieved from https://www.perlego.com/book/1837617/brain-mapping-the-methods-pdf (Original work published 2002)
Chicago Citation
Toga, Arthur, and John Mazziotta. (2002) 2002. Brain Mapping: The Methods. 2nd ed. Elsevier Science. https://www.perlego.com/book/1837617/brain-mapping-the-methods-pdf.
Harvard Citation
Toga, A. and Mazziotta, J. (2002) Brain Mapping: The Methods. 2nd edn. Elsevier Science. Available at: https://www.perlego.com/book/1837617/brain-mapping-the-methods-pdf (Accessed: 15 October 2022).
MLA 7 Citation
Toga, Arthur, and John Mazziotta. Brain Mapping: The Methods. 2nd ed. Elsevier Science, 2002. Web. 15 Oct. 2022.