![]()
CHAPTER 1
Introduction: BRIC and the World Economy
The BRIC countries is an expression created by the British economist Jim O'Neill from the Goldman Sachs Investment Bank that stands for Brazil, Russia, India, and China, the four largest emerging countries most analyzed and debated nowadays. These countries have had an expanded level of development opportunities, during the past few years. They have been studied together as they represent a significant change in the global markets after starting the liberalization of their economies during the 1990s. The BRIC countries’ gross domestic product (GDP) is responsible for 43% of world’s GDP, while Europe and the United States together represent 36%. The emerging countries were also responsible for 70% of the growth of the world’s GDP (Arbix and Salerno, 2008). The industrial production in the BRIC countries was very significant during the first few months of 2008, in the beginning of world recession, and they were the ones with the highest rates. China and Brazil had the highest growth rates of industrial production, 16% and 10.1%, respectively. The increase in the industrial production in India (7%) and Russia (6.7%) was lower than that of China and Brazil but still higher than in other important countries as the United States (–0.1%), Japan (1.9%), France (3.2%), and Germany (4.8%) (The Economist, 2008). Most observers are of the view that China’s progress is disproportionately better than the rest of the members of BRIC and that the emergence of China as an economic superpower is largely responsible for the geopolitical imbalance that has long-term implications. But there is no doubt that the economic transformation that is taking place in BRIC is one of the most interesting developments of the 21st century.
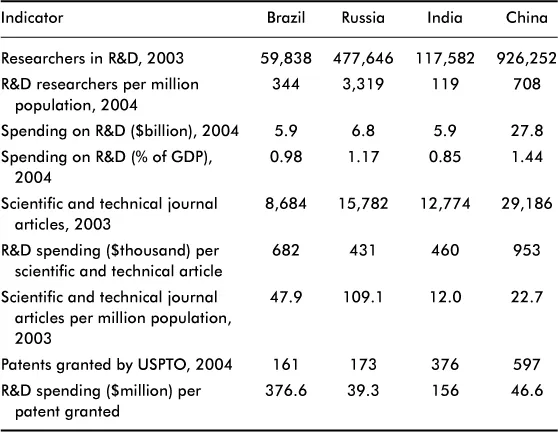
Paul Krugman1 has argued against grouping these four countries together because they are similar only in achieving high growth rates in recent years and particularly against including Russia whose growth is based on energy resources. There are perhaps a whole host of other arguments supporting Krugman’s views. China has a market economy but it is ruled by the Communist Party. Russia was a superpower in the Cold War era and now it has an economy in transition. Brazil’s colonial rule ended long time ago, in 1822, followed by a long history of postcolonial rule primarily marked by dictatorship. Brazil’s experience in democracy is fairly recent. Both during the colonial and postcolonial periods, Brazil was basically a plantation economy and specialized in the export of primary goods, and its entry into the phase of industrial growth is a relatively recent development. India’s colonial rule lasted two centuries, after which it opted for parliamentary democracy. But even during the colonial rule, India had a fairly diversified structure of international trade compared to Brazil. In a postwar bipolar world, India adopted the policy of nonalignment and decided to establish the structure of a mixed economy, with government sector dominating the private commercial sector and economic planning setting the direction for the private sector. This system is popularly known in India as License Permit Raj in which the private enterprises are required to get industrial licenses to set up businesses or permits to import foreign goods. It took a long time for India to realize the ineffectiveness of its economic machinery that produced neither a high rate of economic growth nor an equitable distribution of incomes. All four economies are now market-driven but they show tremendous variations in research and development (R&D) efforts, which would determine their future growth paths. Table 1.1 gives some idea of how different these countries are in terms of growth of technology. Russia is ahead of others in terms of R&D researchers per million populations, but China runs the biggest R&D activities in terms of absolute size. In terms of effectiveness of R&D spending in securing patents, the ranking is: Russia, China, India, and Brazil.
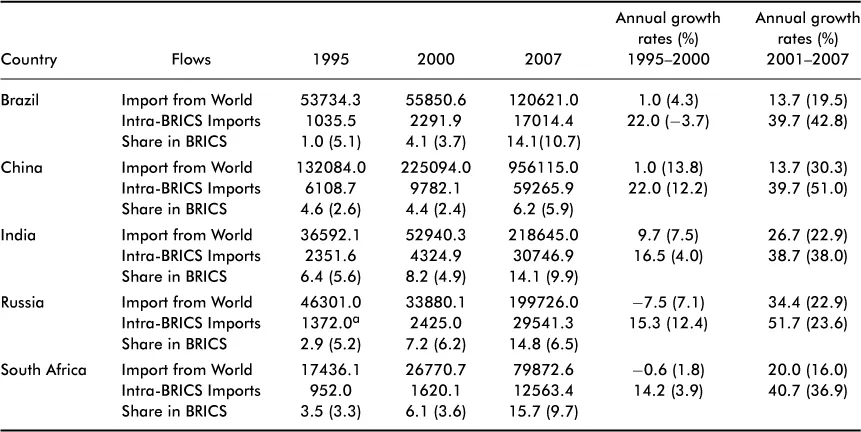
Apart from the tremendous impact the BRIC countries have on the world economy, which is expected to become even stronger in future, one would also predict a great deal of economic cooperation among them through trade and capital flows. The former Soviet Union was one of India’s major trading partners during the Cold War era, and it was relatively easy for India and Russia to reestablish their old economic ties. Until recently, the amount of legal trade between India and China had not been significant, but things are quite different now and China is a major trading partner of India. Ianchovichina et al. (2009) has looked at the long-term effects of the fast-growing economies of China and India on the Russian economy in terms of a global general equilibrium model. The simulation results show that Russia is likely to benefit from terms-of-trade improvements caused by higher energy prices as well as from improvement in the quality and variety of imports of manufactures and services from India and China. However, Russia may develop the symptom of Dutch disease, with its greater reliance on the energy sector and contraction of manufacturing and services sectors. Subsequent studies, such as Pant (2011), have found tremendous expansion of trade within the group of Brazil, Russia, India, China, and South Africa (BRICS) during 1995–2007, as Table 1.2 indicates. Table 1.2 also shows that China’s imports and exports are much more globalized than the other four countries, as its trade shares in BRICS have marginally increased during 1995–2007 compared to others, excluding Russia, whose import shares in BRICS have substantially increased while its export shares show stagnation. India’s import shares in BRICS have been uniformly higher than export shares, and import growth rates have been uniformly higher than export growth rates on a global basis as well as within the BRICS group, which is a signal for future balance of payment problems and eventual devaluation of its currency. Pant (2011) has also looked at the direction as well as the composition of intra-BRICS trade. There is ample evidence that Brazil, India, and South Africa have switched to China as main trade partner. For India and Brazil, this has been at the expense of Russia, whereas for South Africa, this has been at the expense of Brazil. Only Russia has diverted exports going to China in favor of India. China has a dominant position in the BRICS trade matrix, followed by India, as India and China account for 80% or more of the imports from and exports to the other BRICS countries. As regard the commodity composition of intra-BRICS trade, it is based on export of low technology natural resources, largely driven by China’s demand for inputs. Foreign direct investment (FDI) is the best method of diffusing technology globally. However, the current FDI patterns of BRICS countries have no relation with the trade pattern, which makes one wonder whether intra-BRICS trade would be sustainable in future.
Table 1.1. Innovation inputs and outputs indicators — BRIC countries (2003, 2004).
Note: USPTO: United States Patent and Trademark Office.
Source: Mani (2006).
The world recession has impacted BRIC countries in diverse ways and has slowed their growth momentum. Brazil had –0.3% output growth rate in 2009 but recovered in 2010, raising the growth rate to 7.5%. However, low growth rates of less than 3% are projected for 2011–2012 (International Monetary Fund, 2012). The World Development Indicators published by the World Bank show –7.8% GDP growth rate in Russian Federation in 2009 from which the economy recovered in 2010 and achieved a growth rate of 4%, which is much below the growth rate of 10% that was achieved in 2000. From the Reserve Bank of India’s data sources, it appears that India had achieved a GDP growth rate in excess of 9% per year during 2006–2008 and the recession in the world economy brought it down to 6.7% in 2009. Though the economy grew at the rate of 8.4% in the following two years, the projected growth rate for 2012 is only 6.9%. Among the four countries, China has exhibited the highest degree of resilience. In recent years, China achieved the highest GDP growth rate of 14.2% in 2007, which declined to 9.2% in 2009 but increased to 10.4% in 2010, as shown by the World Bank’s World Development Indicators. However, a report from Reuters released in April 2012 indicates that the growth rate in China is weakening, putting the GDP growth rate in the first quarter at 8.1%, which is a downgrade from 8.9% in the previous three months.
Table 1.2. Intra- and extra-BRICS trade (US$ millions), 1995–2007.
aExclude South Africa’s 1995 import figure.
Source: Pant (2011), using UNCTAD stat database. The figures in parentheses are export growth rates or export shares.
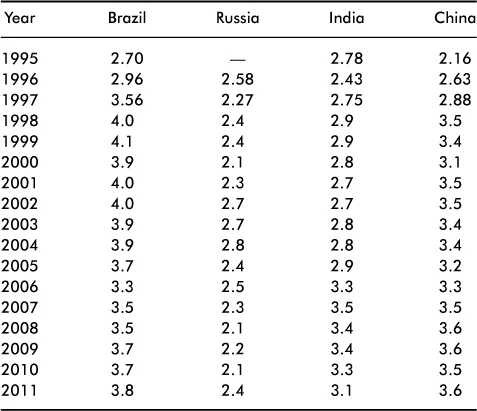
What is more important is that cracks seem to have appeared in the internal growth engines of India and China. One important issue that is being widely debated in international and local media is the lack of transparency in governance or simply corruption. Wedeman (2012) claims that the Chinese economy had a chance to enter a dynamic growth phase before corruption reached significant levels. The principal reasons for the recent “intensification” of corruption are the sale of land use rights and privatization of state-owned enterprises (SOEs) or their assets and opaque processes rife with opportunities for looting. Rising corruption financed by the profits from land sales and privatization deals is different from squeezing businesses and getting a part of their profits. The former is akin to reaping windfall profits from the growing flow of value. The total value generated by land sales and privatization is much bigger than the loot captured by greedy officials, who are careful not to hurt the source of profit or growth. By contrast, preying on businesses siphons off value from existing capital stock, thus retarding growth. According to Wedeman (2012), the Chinese Communist Party is continuously fighting against corruption and is trying to achieve a ’stalemate’ in its war on corruption. Political, bureaucratic, corporate, and individual corruption in India is a cause of major concern. A 2005 study of Transparency International found that more than 55% of Indians had first-hand experience of paying bribes to get a job done in public offices. According to Debroy and Bhandari (2011), an estimated 1.26% of GDP in India is collected by corrupt officials and more than US$ 1 trillion are stashed away in foreign havens. The Brazil Business (September 19, 2011) has estimated that in 2010, 2% of the Brazilian GDP disappeared in corruption, and although this is much less than other members in the BRIC club, it is still a substantial challenge for the Brazilian government. Despite some progress, organizing new investment and production remains cumbersome and bureaucratic. It is costly and time-consuming to launch or close a business. On average, it takes more than 119 days to start a company, compared to the world average of 30 days. Stifling labor regulations continue to undermine employment and productivity growth in Brazil. The Global Integrity Report of 2010 points out that even though Russian Federation has a solid mechanism in place for the public to request information from the government, freedom of the media remains problematic, which is especially visible in privileged position of the ruling class in the national media. Russia also exhibits a significant implementation gap, meaning that many laws on the books are poorly enforced. Indicators assessing the ability to form political parties, election integrity, and political financing transparency all point to this challenge of implementation. Government conflict-of-interest safeguards and checks and balances are inadequate, with effective oversight of the executive posing a major challenge. Citizen input to the budget process is virtually nonexistent, and there is no legislative committee to provide oversight of public funds. While government procurement has become more regulated and transparent, a professional civil service remains elusive. The national ombudsman and supreme audit institution are relatively effective, although the same cannot be said for law enforcement, which faces routine political interference with its work. Transparency International has been publishing corruption perception index (CPI) for a large number of countries since 1995. CPI is measured in the scale of 0 to 10, 0 being the highest and 10 being the lowest measure of corruption. Table 1.3 has CPI measures for BRIC countries. Among the BRIC countries, Brazil is the least and Russia is the most corrupt country, according to CPI. Brazil, India, and China show a regime change so far as corruption is concerned, while corruption in Russia remains stable.
The theoretical literature (Cartier-Bresson, 2000; Klitgaard, 1990; Mauro, 1997; Rege, 2001; Rose-ackerman, 1999; Tanzi, 1998; Tanzi and Davoodi, 1997; Wei, 1997, 1999) on corruption gives one the impression that transparency will definitely promote competition and efficiency and thereby promote economic growth. Rose-ackerman (1999) explains how corruption spreads when political, bureaucratic, and economic markets come into contact, creating opportunities for corruption at every level of the hierarchy, from the highest public office to the lowest. According to Cartier-Bresson (2000), corruption in the developed countries arises mainly from flaws in the democratic system; on the other hand, corruption has more devastating consequences in the developing countries, because it has a tremendous impact on the sovereign functions, which is not the case in the developed countries. The greater vulnerability to corruption in developing countries is due to the fact that they are more prone to government as well as market failures. While Klitgaard (1990) extensively deals with personal experience in corruption in Equatorial Guinea, Mauro (1997) identifies the main causes of corruptions as trade restrictions, government subsidies, price controls, multiple exchange rates and foreign exchange allocation schemes, low wages in the civil service relative to wages in the private sector, rent-seeking related to natural resource endowments, and various sociological factors. Rege (2001) has reviewed rules and procedures of government procurement in developing countries at regional, national, and international levels and points out that even in the presence of benefits of joining Agreement on Government Procurement, most developing countries have decided not to join. Even an interim agreement on transparency, cutting costs, with no national obligation would ensure the most competitive prices for goods and services, fair and equitable criteria for award of contracts, and a reduction in the level of corruption. Tanzi (1998) and Tanzi and Davoodi (1997) have discussed the adverse effect of corruption on economic growth, focusing on how corruption distorts the decision-making process related to public investment. They have found evidence that higher corruption is associated with (i) higher but wasteful public investment, (ii) lower government revenues, (iii) lower expenditure on operations and maintenance, (iv) lower quality of public infrastructure, and (v) lower productivity of public investment. These are the five channels through which corruption reduces the rates of economic growth. The studies by Wei (1997, 1999) arrive at similar conclusions. Corruption is a major obstacle to economic development. It reduces domestic private investment, discourages FDI, inflates government spending, and shifts government spending away from education, health, and infrastructure maintenance toward less efficient (more manipulable) public projects.
Table 1.3. Corruption perception index.
Source: CPI, http://www.transparency.org/research/CPI/overview.
Though most of the studies cited above deal with the effects of corruption on economic growth and economic development, there are some studies (Bardhan, 1997; Gupta et al., 1998) on the impact of corruption on income inequality and poverty. The study by Gupta et al. (1998) is a cross-country regression analysis for 1980–1997 which finds evidence that high and rising corruption increases income inequality and poverty. Specifically, the impact of corruption works through the following channels: lower economic growth, biased tax system favoring the rich and the well-connected, poor targeting of social programs, the use of wealth by the rich to lobby government for favorable policies that perpetuate inequality in asset ownership, lower social spending, unequal access to education, and a higher risk in the investment decisions of the poor.
The concept of a social welfare function is a theoretically complex issue. However, development economics, partly influenced by the contributions of Rawls (1971), makes it quite simple by assuming that social welfare is a function of per capita income, inequality, and poverty, with the effect of per capita income on welfare being positive, while the inequality and poverty having negative effects.2 Therefore, economic growth is an essential component of development, but it is not enough, as reductions in poverty and inequality are equally important. Development policies revolve around the issues related to poverty and inequality, and many of these policies are redistributive in nature. Many countries, developed and developing, have progressive income and wealth taxes, as well as an income transfer mechanism to transfer income from the above-average to below-average earners to reduce income disparities. For instance, US government has food stamp program for the poor as well as unemployment insurance payments. India and Bangladesh have food-for-work programs for the people below the poverty line. Certain provinces in India have employment guarantee schemes, offering employment for a certain number of days in a year to at least one member of poor families. Brazil provides cash incentives to poor families who send their children to school to control child labor practices. Corruption reduces the size of the intended transfer and diverts a part of it to the politicians and bureaucrats, thereby causing a reverse transfer from the below-average to the above-average earners. As a result, the economy is able to achieve neither a rapid growth rate nor an equitable distribution of income. Greater transparency and monitoring of economic activities of the government by independent entities would certainly reduce corruption. However, transparency is costly in terms of monitoring, establishment of new institutions and government procurement regimes, and training of personnel. The achievement of greater transparency may not even be politically feasible. But there is no doubt that a lack of transparency may dampen the growth process and cause substantial income disparities and poverty. It is also conceivable that in the high growth phase of an economy, poverty and inequality rise mainly due to corruption, creating a misleading impression that there exists a trade-off between economic growth and income inequality or poverty.
Corruption may play an important role in the relatio...