![]()
Chapter 1
A Brief History of Evolving Wharton Models 1961–2000
1.Introduction
Lawrence R. Klein initiated econometric modeling of the US economy at the Wharton School around 1961. Since then, as new ideas in modeling came forth, the existing model had been revised and updated by the members of the Wharton team with L. R. Klein for forecasting and analyzing the US economy until around 2000. Each version of the revised models was distinguished from the preceding one by numbering it successively like Wharton Mark III Quarterly Econometric Model or more briefly Mark III, Mark IV, etc. The last one was Mark 10.
In retrospect, the first of Klein’s quarterly models to be called Mark 1 was presented at the NBER conference and published in Model of Income Determination 1964 [1]. This model was expanded and updated by Michael K. Evans and Michael D. McCarthy at the Economic Research Unit of Wharton School under the supervision of Klein. The first stage of Wharton quarterly models was published by M. Evans and L. Klein [2], and then by M. McCarthy [3]. McCarthy named his version Wharton Mark III. Since Wharton Econometric Forecasting Associates (WEFA) was founded in 1969, Econometric modeling work was not only continued by the WEFA group but also used more widely outside the Wharton school. Mark IV was presented at the Joint Economic Committee, the 95th US Congress [4] along with other similar quarterly models by DRI and Chase Econometrics. The number of variables, for instance, in each model was DRI 800, Chase 455, and Wharton 669. R. Jeffrey Green reported that when he was the director of WEFA in 1979–1981, he was engaged in the construction of Mark VI. Soon he moved to the Business School, Indiana University.
Thus, WEFA model had grown increasingly larger in size and more complex. Mark III had already about 320 variables, of which 60 were stochastic and 105 were exogenous. Mark IV contained 669 variables and Mark 9 had about 750 variables. Mark 10 had about 970 variables, of which 320 were stochastic and 170 were exogenous. The expansion of the model was unavoidable by more detailed specification of consumer behavior and sectorial disaggregation of price and demographic variables.
2.Characteristics of the WEFA Mark 10 Model
Mark 10 is a quarterly, econometric model of the US economy built and maintained by the WEFA Group under the supervision of Prof. Klein. It has been used at WEFA to generate both the short-term and long-term US economic outlooks. WEFA economists used it in a variety of consulting projects. A large number of WEFA clients used Mark 10 in their own planning, forecasting, and risk-analysis activities.
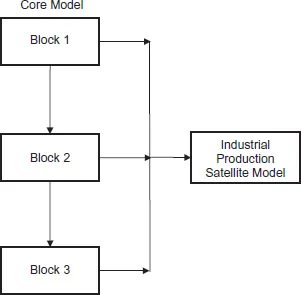
It consists really of two models: a core macroeconometric model and an industry model. The former model is broken into three blocks:
(1)predetermined block of demographic detail,
(2)a simultaneous block of the main economic indicators and final demand categories, and
(3)a post-determined block of variables which do not feed back into the second block. The latter (industry model) is a “satellite model” of the core model. Its results depend on, but do not affect, results from the core model (see Figure 1.1).
Prof. Klein himself never called any models Klein models, but the article he and F. G. Adams wrote [5] and subsequent use of Mark 10 at WEFA show that he regarded it as his group’s model.
3.Characteristics of the Core Macroeconometric Model
Since Mark 10 is used in both short- and long-run simulations, it is designed to exhibit characteristic short-run behavior of the US economy and also have stable long-run properties. As is the tradition at the WEFA Group, dating back to the original short-run forecasting model built under the guidance of L. R. Klein in the 1960s, Mark 10 is a Keynesian model.
To achieve long-run stability, many supply-side features have been incorporated. The key feature of the supply-side is potential gross domestic product (GDP). Potential GDP is the output of the economy when all available capital and labor are employed. Hence, the gap between potential and actual GDP gives a good indication of excess supply/demand conditions. If demand (actual GDP) is close to supply capacity (potential GDP), then prices will reflect these conditions by moving upward.
Figure 1.1. Block Structure of the Mark 10 Model
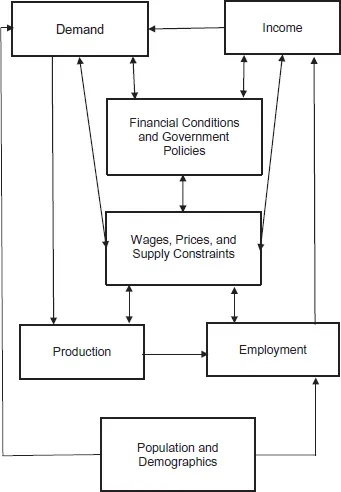
In Mark 10, potential GDP is based on an estimated constant elasticity of substitution (CES) production function of the US economy. The elasticity of substitution between capital and labor, which is constant over time, was estimated to be 0.65, i.e., a 10% rise in the price of capital relative to labor induces a 6.5% decrease in the capital–labor ratio to produce the same output. As shown in Figure 1.2, the potential GDP supply constraint located in the “Wages, Prices and Supply Constraints” box is central to the model; it affects, and is affected by, all other major sectors of the model.
Another important supply-side feature is the Phillips curve for determining wages. When the demand for labor pushes down the unemployment rate, wage inflation accelerates. This increases the demand for capital relative to labor through an increase in the optimal capital stock. The optimal capital stock, determined by the same CES production function mentioned above, rises when the price of labor to capital rises. Increase in the optimal capital stock stimulate investment, dampening demand for labor.
Figure 1.2. Simplified Flow of the Mark 10 Model
The labor supply and demand section of the model uses a great amount of demographic detail for labor supply and a small input–output (I/O) model for demand. There is a great amount of demographic detail determining the labor supply. Population by age and sex is exogenous and the labor force participation rates are also exogenous, making labor supply essentially exogenous as well. The I/O model in Mark 10 is small, with details only for one-digit Standard Industrial Classification Industries, such as mining and construction. The I/O model uses the vector of final demand categories in Mark 10 to determine the required output to produce all the goods demanded. It is simply a truncated version of the Industry Model detailed in Chapter 3. The output calculated in this manner, along with the level of capital stock, then determines the demand for labor.
References
[1]Klein, L. R. (1964). A Postwar Quarterly Model: Description and Application, in Models of Income Determination, eds. by Conference on Research in Income and Wealth, NBER.
[2]Evans, M. K. and L. R. Klein (1968). The Wharton Econometric Forecasting Model, ERU, Department of Economics, Wharton School of Finance and Commerce, University of Pennsylvania.
[3]McCarthy, M. D. (1972). The Wharton Quarterly Econometric Forecasting Model, Mark III ERU, Department of Economics, Wharton School, University of Pennsylvania.
[4]Lee, L. D. (1978). A Comparison of Econometric Models: A Study, US Congress, Joint Economic Committee, Washington: U.S. Govt. Print. Off.
[5]Adams, F. G. and L. R. Klein (1991). Performance of Quarterly Econometric Models of the United States: A New Round of Model Comparisons, in L. R. Klein, eds. (1991), Comparative Performance of US Econometric Models, Oxford University Press, New York, relied on Mark 9, but WEFA continued its activity and used Mark 10 throughout the 90s.
![]()
Chapter 2
Outline of the Core Model
The core model of WEFA Mark 10 in this book constructs the US Economy model by subdividing the whole system into the following 10 different sectors plus one miscellaneous sector: (1) Final demand, (2) Income determination, (3) Labor market, (4) Price and costs, (5) Government revenue and expenditure, (6) Production and sectoral demand, (7) Population and demographics, (8) Money and finance, (9) Auto and petroleum market, (10) International sector, and (11) Miscellaneous.
This chapter describes the basic way of thinking in our core model, following the exposition given in Chapter 1, and the detailed equations are provided in Chapter 5.
1.Final Demand Sectors and Income Determination
The national income and product accounts measures the outcomes of central circular flow of economic activities in three sectors (consumer households, businesses and governments) of domestic spending, income from abroad and tax policy in this model. If the rest of the model were frozen, these blocks would produce a Keynesian system similar to the model pioneered by Tinbergen and Klein. This Mark 10, however, has imbedded the additional price factors in the investment and other primary demand equations. Some expositions are given in the following sections.
1.1.Consumer spending on durable, nondurable goods and services
They are distinguished as follows. Durable goods are divided into six categories: furniture and household equipment; new cars; used cars; truck, recreation vehicle; tire, tube, accessories and parts; other durable goods. Nondurable goods are divided into six categories: two food and beverage categories; clothing and shoes; gasoline and oil; fuel oil and coal; other nondurable goods. Services are divided into seven categories: three household operations; two transportation services; medical care; other services.
Main determinants of consumption are income, relative prices, and demographics. In addition, the consumer sentiments index, which is monitored by the University of Michigan, Survey of Consumer Sentiment, is used, where appropriate, to capture the cyclical behavior of some consumption categories. Short- and long-run effects have been separated by using polynomial lag distributions, especially in those cases where relative price appears important.
1.2.Business investment
This includes 14 investment categories: four durable equipments, six business constructions, and four inventories. Nonresidential investment is determined, based on the neo-classical formulation as outlined by Hall and Jorgenson and others [1]. Output variable (usually GNP), user cost of capital, defined on the basis of Dale Jorgenson’s work, and corporate cash flow, which reflects the cost of financing investment projects. User cost of capital is used directly in some investment categories or affects investment through the optimal capital stock. Of n...