Your plain-English guide to understanding and using technical chart patterns
Chart pattern analysis is not only one of the most important investing tools, but also one of the most popular. Filled with expert insights and practical advice from one of the best in the business, Getting Started in Chart Patterns, Second Edition helps new and seasoned traders alike profit by tracking and identifying specific chart patterns.
Substantially revised and expanded, this new edition stay true to the original, with author Thomas Bulkowski's frank discussion of how trading behavior can affect the bottom line. Interwoven throughout the technical presentations are fascinating anecdotes drawn from the author's quarter-century as a professional trader that vividly demonstrate how one of the best in the business leverages the power of chart patterns.
Includes additional charts for ETFs and mutual funds
Introduces more than 40 key chart formations, as well as trading tactics that can be used in conjunction with them
Supplies actual trades, with their corresponding dollar amounts
If you're looking to gain a better understanding of this discipline, look no further than the Second Edition of Getting Started in Chart Patterns.
Preguntas frecuentes
¿Cómo cancelo mi suscripción?
Simplemente, dirígete a la sección ajustes de la cuenta y haz clic en «Cancelar suscripción». Así de sencillo. Después de cancelar tu suscripción, esta permanecerá activa el tiempo restante que hayas pagado. Obtén más información aquí.
¿Cómo descargo los libros?
Por el momento, todos nuestros libros ePub adaptables a dispositivos móviles se pueden descargar a través de la aplicación. La mayor parte de nuestros PDF también se puede descargar y ya estamos trabajando para que el resto también sea descargable. Obtén más información aquí.
¿En qué se diferencian los planes de precios?
Ambos planes te permiten acceder por completo a la biblioteca y a todas las funciones de Perlego. Las únicas diferencias son el precio y el período de suscripción: con el plan anual ahorrarás en torno a un 30 % en comparación con 12 meses de un plan mensual.
¿Qué es Perlego?
Somos un servicio de suscripción de libros de texto en línea que te permite acceder a toda una biblioteca en línea por menos de lo que cuesta un libro al mes. Con más de un millón de libros sobre más de 1000 categorías, ¡tenemos todo lo que necesitas! Obtén más información aquí.
¿Perlego ofrece la función de texto a voz?
Busca el símbolo de lectura en voz alta en tu próximo libro para ver si puedes escucharlo. La herramienta de lectura en voz alta lee el texto en voz alta por ti, resaltando el texto a medida que se lee. Puedes pausarla, acelerarla y ralentizarla. Obtén más información aquí.
¿Es Getting Started in Chart Patterns un PDF/ePUB en línea?
Sí, puedes acceder a Getting Started in Chart Patterns de Thomas N. Bulkowski en formato PDF o ePUB, así como a otros libros populares de Negocios y empresa y Finanzas. Tenemos más de un millón de libros disponibles en nuestro catálogo para que explores.
An investor I’ll call Gina e-mailed me her story. She had saved $100,000 in her IRA. Then she bought this book and used its teachings to grow her account. She bought exchange-traded funds that tracked the metals. A year later, her account was worth $1.1 million. She made a million in one year. Wow.
I had a hard time believing her story so I talked to my brother. “She’s an outlier.” She’s the exception to the rule, the one person in the world that makes it to the very top. She was in the right place at the right time and did everything right to make a bundle.
If Gina can do it, why not you?
What Are Chart Patterns?
Have you ever strolled into the woods and found footprints in the soil? If it’s muddy, you may see bird tracks. You may also find larger tracks from cats, dogs, and even deer. You don’t see the actual animal, just their tracks. If you follow the tracks, perhaps you can discover a beautiful creature.
When people trade a stock, they leave behind a footprint. Volume increases. The price bar printed on the chart may also change. String enough of those price bars together and they form patterns, which we call chart patterns.
I used to think that chart patterns were the footprints of the smart money. I think the dumb money steers the feet, too. What does that mean?
chart patterns
chart patterns are recurring formations that appear on price charts. They reflect the trading behavior of professional traders, companies, and individuals.
Imagine that you sell office supplies to a retailer called BOSS (Best Office SupplieS, a fictional company), which, in turn, sells them to the public. Your business is prospering because BOSS is buying lots of your products. With that knowledge, you purchase their stock.
Six months later, you notice that the rate of their purchases has slowed. Uh-oh. It could be a seasonal fluctuation. Fewer people need office supplies when they are on vacation during the summer. But the slowdown persists. You decide to sell the stock.
Imagine another scenario when you meet your good friend Barry, the CEO of BOSS. He is looking glum, as if someone spit into his cereal. He shakes his head and remarks, “We’re being sued. If they win, we’re sunk. If we win, we still take a big hit from legal fees.”
“Your stock is going to take a pounding.”
“No kidding,” he says.
The next day you dump your holdings in BOSS.
Enter the Retail Investor
It’s not only the smart money leaving footprints on the stock charts. What about people without inside information, the so-called retail investors?
Anyone can drive by BOSS and see vacant parking lots. If people inside the store are pushing around empty carts with no one waiting in line at the cashier, then that can’t be good for business.
That scenario happens with apparel retailers all the time. Last year’s fad has faded, and the chain is left with too many lemon-yellow polka dot sweaters. In summer!
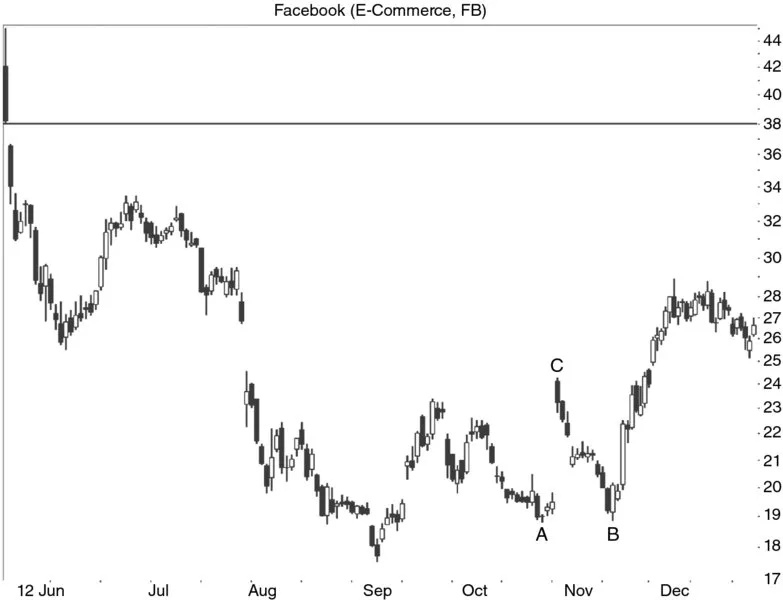
Facebook is a good example of the public’s excitement (fear and greed) for a stock. Facebook is an Internet company that went public in mid-2012 (Figure 1.1). It seemed as if the entire world was in love with the company. Two days before the initial public offering (IPO), the company said it would increase the number of shares offered by 25% due to demand.
FIGURE 1.1 Facebook has an initial offering price of $38, shown at the horizontal line on the daily scale.
One analyst said the stock could reach as high as $60 on the first day.
The underwriters priced the IPO at $38, and the stock opened at just over $42. It reached a high of 45 but closed just pennies above the offering price.
Then look what happened. The stock didn’t hit 60; rather, it went the other way. It plummeted like a climber slipping off the Balcony on Mount Everest, bouncing down until it reached base camp at 17.55 in early September, less than half the offering price.
Could retail investors have predicted such a move by looking at the charts of other IPOs? LinkedIn Corporation’s stock opened at 83 but within six months, the stock hit a low of 60.14.
Of course, Facebook could have been the exception. Google, for example, opened at 100, and six months later, it was trading at almost 200.
These are just examples of the footprints left by the smart and dumb money. Our job as investors and traders is to recognize those footprints, decide which are valuable, and profit from them.
Use prior price action to help determine future price movement.
Advantages of Chart Patterns
What advantages do chart patterns offer when trading a stock? The first two that come to mind are that chart patterns give buy and sell signals.
Chart patterns issue clear buy signals.
Chart patterns issue clear sell signals.
When price closes above the trendline boundary of a chart pattern, that’s a buy signal. A trading signal can also occur when price closes above the top or below the bottom of a chart pattern.
For example, Figure 1.1 shows a double bottom at AB. When price closes above the high between the two bottoms (C), it confirms the pattern as a valid one and signals a buy.
The sell side is similar. Sell signals occur when price closes outside a trendline boundary or below the bottom of a chart pattern.
There’s no guessing about where the signal might be. The rules are known.
A third advantage is that signals are timely. If you have day-traded a stock using a moving average, you may know about this. Imagine a stock gap significantly higher at the day’s open (opening gaps are common).
A 20-period moving average, for example, needs 20 samples to fill the pipeline and give a result. If you’re on the one-minute scale, it will be 20 minutes before you see a simple moving average not influenced by the gap.
If you use two days of price data, then the moving average will be influenced by the gap up. One trader I know didn’t recognize these effects and lost money because of it.
Indicators lag price. Using our simple moving average as an example, what happened at the gap up to 20 minutes ago influences the current value of the moving average.
Chart patterns don’t suffer this type of delay.
Chart patterns do not lag price.
One of the things many traders find useful is that chart patterns give an estimate of where price might go (called the measure rule, which is based on the height of the pattern). Often the estimate serves as a minimum price move, not a maximum.
The height of the chart patterns helps set a price target.
Disadvantages of Chart Patterns
Chart patterns have their flaws, too. You ...
Índice
Cover
Series
Title Page
Copyright
Dedication
Preface to First and Second Editions
Acknowledgments
Chapter 1: Introduction to Chart Patterns
Chapter 2: Identifying Chart Patterns
Chapter 3: The Truth about Trendlines
Chapter 4: Support and Resistance: The Most Important Chart Patterns
Chapter 5: Ten Buy Signals
Chapter 6: Ten Sell Signals
Chapter 7: Special Situations
Chapter 8: Busted Patterns: Making Money by Trading Failure
Chapter 9: More Trades: Putting It All Together
Chapter 10: The Art of Trading: Checklists
Chapter 11: Crunching the Numbers
Glossary
Visual Index of Chart Patterns
About the Author
Index
Wiley End User License Agreement
Estilos de citas para Getting Started in Chart Patterns
APA 6 Citation
Bulkowski, T. (2014). Getting Started in Chart Patterns (2nd ed.). Wiley. Retrieved from https://www.perlego.com/book/996661/getting-started-in-chart-patterns-pdf (Original work published 2014)
Chicago Citation
Bulkowski, Thomas. (2014) 2014. Getting Started in Chart Patterns. 2nd ed. Wiley. https://www.perlego.com/book/996661/getting-started-in-chart-patterns-pdf.
Harvard Citation
Bulkowski, T. (2014) Getting Started in Chart Patterns. 2nd edn. Wiley. Available at: https://www.perlego.com/book/996661/getting-started-in-chart-patterns-pdf (Accessed: 14 October 2022).
MLA 7 Citation
Bulkowski, Thomas. Getting Started in Chart Patterns. 2nd ed. Wiley, 2014. Web. 14 Oct. 2022.