eBook - ePub
Evidence-Based Technical Analysis
Applying the Scientific Method and Statistical Inference to Trading Signals
David Aronson
This is a test
- English
- ePUB (adapté aux mobiles)
- Disponible sur iOS et Android
eBook - ePub
Evidence-Based Technical Analysis
Applying the Scientific Method and Statistical Inference to Trading Signals
David Aronson
Détails du livre
Aperçu du livre
Table des matières
Citations
À propos de ce livre
Evidence-Based Technical Analysis examines how you can apply the scientific method, and recently developed statistical tests, to determine the true effectiveness of technical trading signals. Throughout the book, expert David Aronson provides you with comprehensive coverage of this new methodology, which is specifically designed for evaluating the performance of rules/signals that are discovered by data mining.
Foire aux questions
Comment puis-je résilier mon abonnement ?
Il vous suffit de vous rendre dans la section compte dans paramètres et de cliquer sur « Résilier l’abonnement ». C’est aussi simple que cela ! Une fois que vous aurez résilié votre abonnement, il restera actif pour le reste de la période pour laquelle vous avez payé. Découvrez-en plus ici.
Puis-je / comment puis-je télécharger des livres ?
Pour le moment, tous nos livres en format ePub adaptés aux mobiles peuvent être téléchargés via l’application. La plupart de nos PDF sont également disponibles en téléchargement et les autres seront téléchargeables très prochainement. Découvrez-en plus ici.
Quelle est la différence entre les formules tarifaires ?
Les deux abonnements vous donnent un accès complet à la bibliothèque et à toutes les fonctionnalités de Perlego. Les seules différences sont les tarifs ainsi que la période d’abonnement : avec l’abonnement annuel, vous économiserez environ 30 % par rapport à 12 mois d’abonnement mensuel.
Qu’est-ce que Perlego ?
Nous sommes un service d’abonnement à des ouvrages universitaires en ligne, où vous pouvez accéder à toute une bibliothèque pour un prix inférieur à celui d’un seul livre par mois. Avec plus d’un million de livres sur plus de 1 000 sujets, nous avons ce qu’il vous faut ! Découvrez-en plus ici.
Prenez-vous en charge la synthèse vocale ?
Recherchez le symbole Écouter sur votre prochain livre pour voir si vous pouvez l’écouter. L’outil Écouter lit le texte à haute voix pour vous, en surlignant le passage qui est en cours de lecture. Vous pouvez le mettre sur pause, l’accélérer ou le ralentir. Découvrez-en plus ici.
Est-ce que Evidence-Based Technical Analysis est un PDF/ePUB en ligne ?
Oui, vous pouvez accéder à Evidence-Based Technical Analysis par David Aronson en format PDF et/ou ePUB ainsi qu’à d’autres livres populaires dans Business et Finance. Nous disposons de plus d’un million d’ouvrages à découvrir dans notre catalogue.
PART I
Methodological, Psychological, Philosophical, and Statistical Foundations
CHAPTER 1
Objective Rules and Their Evaluation
This chapter introduces the notion of objective binary signaling rules and a methodology for their rigorous evaluation. It defines an evaluation benchmark based on the profitability of a noninformative signal. It also establishes the need to detrend market data so that the performances of rules with different long/short position biases can be compared.
THE GREAT DIVIDE: OBJECTIVE VERSUS SUBJECTIVE TECHNICAL ANALYSIS
Technical analysis (TA) divides into two broad categories: objective and subjective. Subjective TA is comprised of analysis methods and patterns that are not precisely defined. As a consequence, a conclusion derived from a subjective method reflects the private interpretations of the analyst applying the method. This creates the possibility that two analysts applying the same method to the same set of market data may arrive at entirely different conclusions. Therefore, subjective methods are untestable, and claims that they are effective are exempt from empirical challenge. This is fertile ground for myths to flourish.
In contrast, objective methods are clearly defined. When an objective analysis method is applied to market data, its signals or predictions are unambiguous. This makes it possible to simulate the method on historical data and determine its precise level of performance. This is called back testing. The back testing of an objective method is, therefore, a repeatable experiment which allows claims of profitability to be tested and possibly refuted with statistical evidence. This makes it possible to find out which objective methods are effective and which are not.
The acid test for distinguishing an objective from a subjective method is the programmability criterion: A method is objective if and only if it can be implemented as a computer program that produces unambiguous market positions (long,1 short,2 or neutral3). All methods that cannot be reduced to such a program are, by default, subjective.
TA RULES
Objective TA methods are also referred to as mechanical trading rules or trading systems. In this book, all objective TA methods are referred to simply as rules.
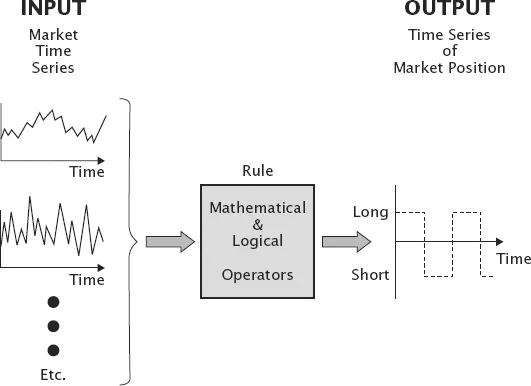
A rule is a function that transforms one or more items of information, referred to as the rule’s input, into the rule’s output, which is a recommended market position (e.g., long, short, neutral). Input(s) consists of one or more financial market time series. The rule is defined by one or more mathematical and logical operators that convert the input time series into a new time series that consists of the sequence of recommended market position (long, short, out-of-the-market). The output is typically represented by a signed number (e.g., +1 or −1). This book adopts the convention of assigning positive values to indicate long positions and negative values to indicate shorts position. The process by which a rule transforms one or more input series into an output series is illustrated in Figure 1.1.
FIGURE 1.1 TA rule transforms input time series into a time series of market position.
A rule is said to generate a signal when the value of the output series changes. A signal calls for a change in a previously recommended market position. For example a change in output from +1 to −1 would call for closing a previously held long position and the initiation of a new short position. Output values need not be confined to {+1, −1}. A complex rule, whose output spans the range {+10, −10}, is able to recommend positions that vary in size. For example, an output of +10 might indicate that 10 long positions are warranted, such as long 10 contracts of copper. A change in the output from +10 to +5 would call for a reduction in the long position from 10 contracts to 5 (i.e., sell 5).
Binary Rules and Thresholds
The simplest rule is one that has a binary output. In other words, its output can assume only two values, for example +1 and −1. A binary rule could also be designed to recommend long/neutral positions or short/neutral positions. All the rules considered in this book are binary long/short {+1,–1}.
An investment strategy based on a binary long/short rule is always in either a long or short position in the market being traded. Rules of this type are referred to as reversal rules because signals call for a reversal from long to short or short to long. Over time a reversal rule produces a time series of +1’s and −1’s that represent an alternating sequence of long and short positions.
The specific mathematical and logical operators that are used to define rules can vary considerably. However, there are some common themes. One theme is the notion of a threshold, a critical level that distinguishes the informative changes in the input time series from its irrelevant fluctuations. The premise is that the input time series is a mixture of information and noise. Thus the threshold acts as a filter.
Rules that employ thresholds generate signals when the time series crosses the threshold, either by the rising above it or falling beneath it. These critical events can be detected with logical operators called inequalities such as greater-than (>) and less-than (<). For example, if the time series is greater than the threshold, then rule output = +1, otherwise rule output = −1.
A threshold may be set at a fixed value or its value may vary over time as a result of changes in the time series that is being analyzed. Variable thresholds are appropriate for time series that display trends, which are large long-lasting changes in the level of the series. Trends, which make fixed threshold rules impractical, are commonly seen in asset prices (e.g., S&P 500 Index) and asset yields (AAA bond yield). The moving average and the Alexander reversal filter, also known as the zigzag filter, are examples of time series operators that are commonly used to define variable thresholds. The operators used in the rules discussed in this book are detailed in Chapter 8.
The moving-average-cross rule is an example of how a variable threshold is used to generate signals on a time series that displays trends. This type of rule produces a signal when the time series crosses from one side of its moving average to the other. For example;
If the time series is above its moving average, then the rule output value = +1, otherwise the rule output value = −1.
This is illustrated in Figure 1.2.
FIGURE 1.2 Moving-average-cross rule.

Because it employs a single threshold, the signals generated by the moving-average-cross rule are, by definition, mutually exclusive. Given a single threshold, there are only two possible conditions—the times series is either above or below4 the threshold. The conditions are also exhaustive (no other possibilities).5 Thus, it is impossible for the rule’s signals to be in conflict.
Rules with fixed value thresholds are appropriate for market time series that do not display trends. Such time series are said to be stationary. There is a strict mathematical definition of a stationary time series, but here I am using the term in a looser sense to mean that a series has a relatively stable average value over time and has fluctuations that are confined to a roughly horizontal range. Technical analysis practitioners often refer to these series as oscillators.
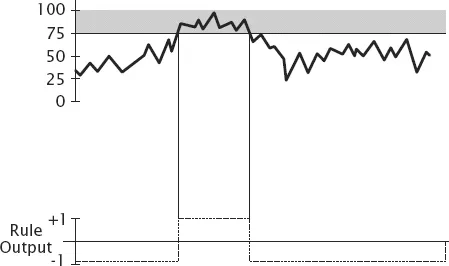
Time series that display trends can be detrended. In other words, they can be transformed into a stationary series. Detrending, which is described in greater detail in Chapter 8, frequently involves taking differences or ratios. For example the ratio of a time series to its moving average will produce a stationary version of the original time series. Once detrended, the series will be seen to fluctuate within a relatively well-defined horizontal range around a relatively stable mean value. Once the time series has been made stationary, fixed threshold rules can be employed. An example of a fixed threshold rule using a threshold of value of 75 is illustrated in Figure 1.3. The rule has an output a value of +1 when the series is greater than the threshold and a value of −1 at other times.
FIGURE 1.3 Rule with a single fixed threshold.
Binary Rules from Multiple Thresholds
As pointed out earlier, binary rules are derived, quite naturally, from a single threshold because the threshold defines two mutually exclusive and exhaustive conditions: the time series is either above or below threshold. However, binary rules can also be derived using multiple thresholds, but employing more than one threshold creates the possibility that the input time series can assume more than two conditions. Consequently, multiple threshold rules require a more sophisticated logical operator than the simple inequality operator (greater-than or less-than), which suffices for single threshold rules.
When there are two or more thresholds, there are more than two possible conditions. For example, with two thresholds, an upper and lower, there are three possible conditions for the input time series. It can be above the upper, below the lower, or between the two thresholds. To create a binary rule in this situation, the rule is defined in terms of two mutually exclusive events. An event is defined by the time series crossing a particular threshold in a particular direction. Thus, one event triggers one of the rule’s output values, which is maintained until a second event, which is mutually exclusive of the first, triggers the other output value. For example, an upward crossing of the upper threshold triggers a +1, and a downward crossing of the lower threshold triggers a −1.
A logical operator that implements this type of rule is referred to as a flip-flop. The name stems from the fact that the rule’s output value flips one way, upon the occurrence of one event, and then flops the other way, upon the occurrence of the second event. Flip-flop logic can be used with either variable or fixed threshold rules. An example of a rule based on two variable thresholds is the moving average band rule. See Figure 1.4. Here, the moving average is surrounded by an upper and lower band. The bands may be a fixed percentage above and below the moving average, or the deviation of the bands may vary based on of the recent volatility of the times, as is the case with the Bollinger Band.6 An output value of +1 is tr...
Table des matières
- Cover
- Contents
- Title
- Copyright
- Dedication
- Acknowledgments
- About the Author
- Introduction
- Part I: Methodological, Psychological, Philosophical, and Statistical Foundations
- Part II: Case Study: Signal Rules for the S&P 500 Index
- Appendix: Proof That Detrending Is Equivalent to Benchmarking Based on Position Bias
- Index
Normes de citation pour Evidence-Based Technical Analysis
APA 6 Citation
Aronson, D. (2011). Evidence-Based Technical Analysis (1st ed.). Wiley. Retrieved from https://www.perlego.com/book/1008237/evidencebased-technical-analysis-applying-the-scientific-method-and-statistical-inference-to-trading-signals-pdf (Original work published 2011)
Chicago Citation
Aronson, David. (2011) 2011. Evidence-Based Technical Analysis. 1st ed. Wiley. https://www.perlego.com/book/1008237/evidencebased-technical-analysis-applying-the-scientific-method-and-statistical-inference-to-trading-signals-pdf.
Harvard Citation
Aronson, D. (2011) Evidence-Based Technical Analysis. 1st edn. Wiley. Available at: https://www.perlego.com/book/1008237/evidencebased-technical-analysis-applying-the-scientific-method-and-statistical-inference-to-trading-signals-pdf (Accessed: 14 October 2022).
MLA 7 Citation
Aronson, David. Evidence-Based Technical Analysis. 1st ed. Wiley, 2011. Web. 14 Oct. 2022.