![]()
Part I
OVERVIEW
![]()
Chapter 1
Foreign Exchange Market Structure, Players, and Evolution
Michael R. King
Richard Ivey School of Business, University of Western Ontario
Carol Osler
Brandeis International Business School, Brandeis University
Dagfinn Rime
Norges Bank, Norwegian University of Science and Technology
1.1 Introduction
It would be hard to overstate the importance of exchange rates for the world economy. They affect output and employment through real exchange rates. They affect inflation through the cost of imports and commodity prices. They affect international capital flows through the risks and returns of different assets. Exchange rates are justifiably a major focus for policymakers, the public, and, of course, the media.
To understand exchange rates, it is essential to know how these prices are determined. This chapter describes the FX market and presents new evidence on recent trends, thereby setting the stage for the rest of the handbook. It presents stylized facts on the market's size and composition. It then describes more closely the motives, incentives, and constraints of the major players. Trading is a search problem, and the constraints and costs related to this search are affected by the structure of the market. Our starting point is that the exchange rates are primarily driven by new information about economic fundamentals. In this light, we review which agents bring information to the market and exactly how their information becomes embedded in the market price.
The chapter describes the momentous changes in trading practices and market structure which have taken place over the recent decades. It concludes by presenting new evidence on some of the most recent technological advances. Twenty-five years ago, most FX trading involved the telephone and all trading involved institutions: individuals were essentially shut out. Trading was opaque, there was a sharp division between interdealer trading and dealer–customer trading, and market concentration among dealers was low.
Today, only the least liquid corners of the FX market can still be described this way. In the liquid markets, telephones are obsolete. New electronic trading platforms have streamlined trade processing and settlement, reduced operational risks, and lowered trading costs. Lower trading costs have enabled the participation of retail traders and the adoption of new strategies such as high frequency trading—a form of computer-automated trading that relies on high execution speeds to make profits from small price movements. Since streaming real-time prices are now available to virtually all participants, these markets are now regarded as transparent. On some of the new platforms, any trader can provide liquidity, so the division between dealers and their most sophisticated customers is, at times, ambiguous. To remain competitive, the major dealing banks have made heavy investments in software and hardware, which has led to sharply higher concentration among market makers.
1.2 Geography and Composition of Currency Trading
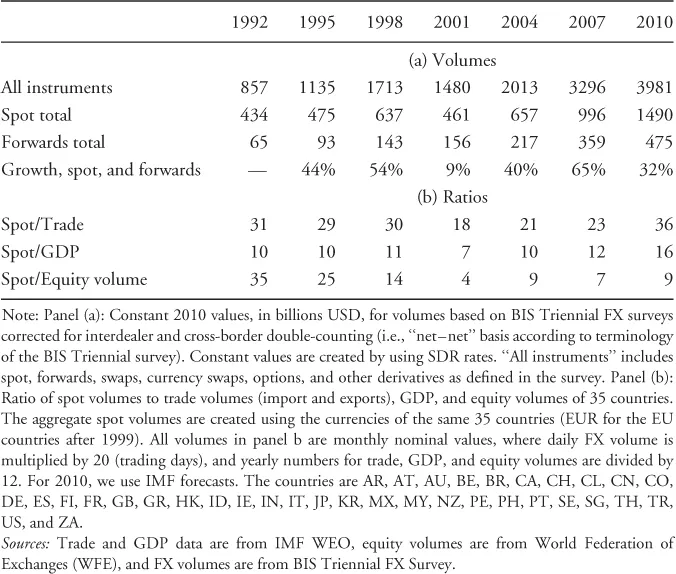
Given the pervasive influence of exchange rates, it is no surprise that the dollar value of trading activity in spot and forward FX market dwarfs most other economic measures (BIS, 2010). With daily average turnover estimated at $2.0 trillion, the market is 36 times larger than the combined exports and imports for the world's 35 largest economies, 16 times their combined GDP, and roughly 10 times exchange-traded equity turnover.
FX trading volume has exploded reflecting an electronic revolution that has lowered trading costs, attracted new groups of market participants, and enabled aggressive new trading strategies. Between 1998 and 2010, turnover in the FX market grew by over 250% (BIS, 2010). The associated 8.4% average annual growth rate far exceeds the contemporary 5.5% annual expansion of global real GDP (Table 1.1).
Table 1.1 FX Turnover and Growth: Comparison with Trade, GDP, and Equity Trading Volume
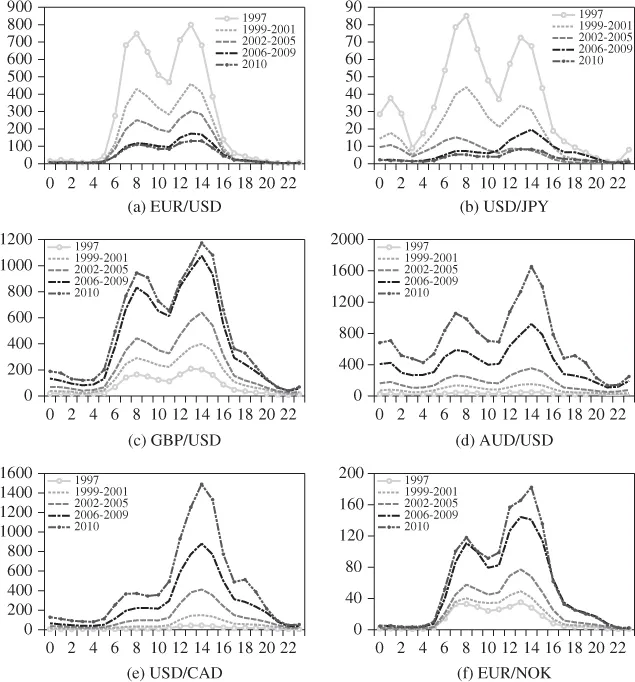
Many aspects of the FX market remain constant despite the electronic revolution. As has been true for decades, the markets remain decentralized with high liquidity and continuous trading (Lyons, 2001; Rime, 2003; Osler, 2009). As ever, the trading day begins when dealers arrive for work in Australia and Asia. Activity then moves to Europe when markets open in Frankfurt, London, and Paris, and finishes late in the afternoon in New York. As always, there is no time during the day when the market formally closes, although there is a brief lull in activity between about 19:00 and 22:00 GMT, when most New York traders have gone home and most Sydney traders are still on their way to work (Figure 1.1). As ever, overall market liquidity is deepest when both London and New York are open, though liquidity for most individual currencies tends to be deepest during their local trading hours.
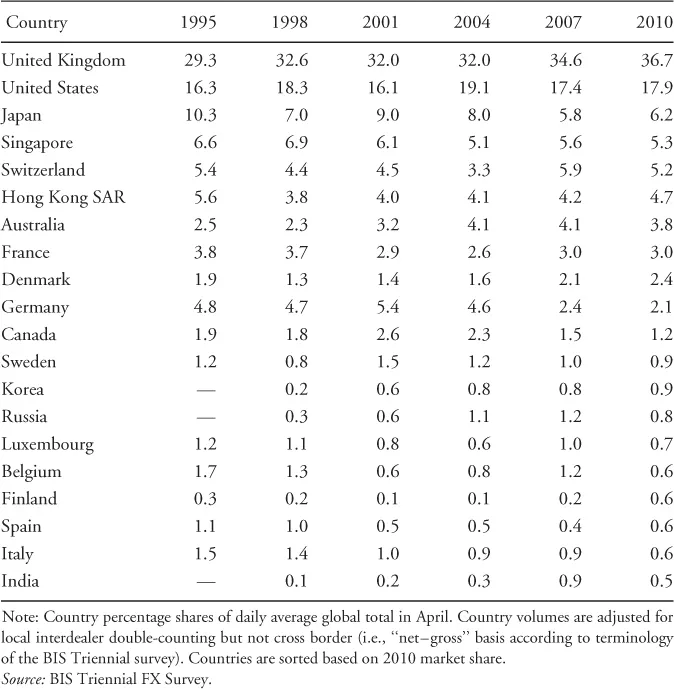
FX trading remains heavily concentrated in London, which captures over one-third of global trading, and New York, which captures almost one-fifth of trading (Table 1.2). London's traditional dominance in FX grew out of the United Kingdom's worldwide economic dominance in the nineteenth century. It remains secure at the beginning of the twenty-first century because of its geographic location: London's morning session overlaps with Asian trading and its afternoon session overlaps with New York's trading. Trading in the Asia-Pacific region, which in aggregate accounts for about one-quarter of global trading, is dispersed among Tokyo, Hong Kong, Singapore, and Sydney. Latin America, Africa, and the Middle East each account for less than 1% of global turnover.
Table 1.2 Geographical Distribution of Global Foreign Exchange Market Turnover (%)
Despite the continued dominance of London and New York, there have been some subtle shifts in the global distribution of currency trading. The advent of the euro (EUR) brought a decline in the share of European trading outside of London. Meanwhile, rapid economic growth in Asia has supported a surge in trading in the Asian regional centers. Hong Kong and Singapore now vie in importance with traditional European centers such as Switzerland and France.
1.2.1 Which Currencies Are Traded?
Another unchanging aspect of the FX market is the dominance of the US dollar (USD), which is still involved on one side of roughly three-quarters of all spot transactions (Table 1.3).1 The dollar's dominance reflects the market's practice of trading minor currencies via a major currency (called the vehicle currency). A trade from Mexican pesos (MXP) to Australian dollars (AUD), for example, would typically involve two trades, one from MXP to USD and the second from USD to AUD. This “vehicle” trading through the major crosses concentrates liquidity in a narrower range of currency pairs, reducing overall transaction costs.
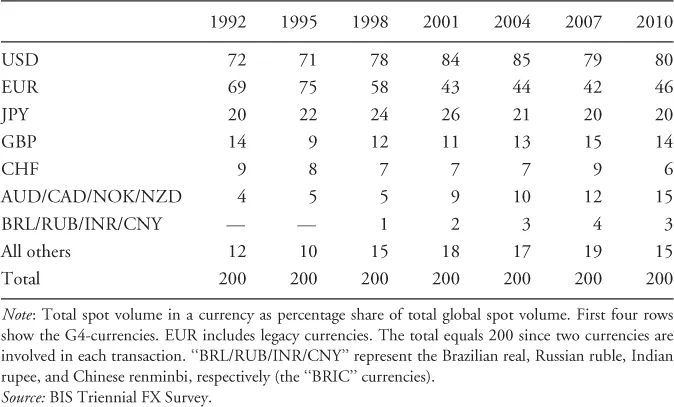
Table 1.3 Currency Distribution of Spot Turnover (%)
The EUR is involved in 46% of trades, in part because it serves as the vehicle currency within the eurozone.2 The next most actively traded currencies are the JPY (20%) and the UK pound (GBP, 14%). Together, these four currencies are known as “the majors” (or G4).3
The next tier below the majors comprises the AUD (7.5%), the Swiss franc (CHF, 6.2%), and the Canadian dollar (CAD, 5.2%). A notable recent shift is the rising share of the so-called commodity currencies, specifically the AUD, CAD, NOK, and the New Zealand dollar (NZD). These currencies' combined share rose from 7% in 1998 to 16% in 2010.
The share of emerging-market currencies rose sharply in the 1990s but has been fairly stable around 18% since then. Nonetheless, currencies from the most advanced emerging markets, such as the South Korean won (KRW) and Hong Kong dollar (HKD), have more than doubled their market share since 1998 and now rival the Swedish krona (SEK). Turnover in more recently emerging countries, such as Turkey, Thailand, Brazil, and India, has grown even faster.
The conventions governing the quotation of different currency pairs have also been fairly stable over time. Most exchange rates are expressed as units of a given currency required to purchase 1 USD. The exceptions are the EUR, the GBP, the AUD, and the NZD, which are quoted as the base currency (i.e., EUR/USD = USD per EUR). Most exchange rates are quoted to five significant digits, with the final (or smallest) digit known as a “pip....