![]()
1
Measuring Capital and Technology
An Expanded Framework
Carol Corrado, Charles Hulten, and Daniel Sichel
1.1 Introduction and Background
The last two hundred years have witnessed dramatic gains in the standard of living in the United States, driven by the technological innovations introduced by the Industrial Revolution and carried forward by the evolution of technology since then. This evolution is reflected both in the development of new products (electric lighting, automobiles, open-heart surgery) and in the improved efficiency of production processes (the assembly line, just-in-time inventory controls, computer-aided design). Growth economists have undertaken the important task of quantifying these developments and of sorting out the relative importance of the factors that drive sustained increases in real output. This effort has increased in recent years with the debate over the “new economy” and the question of whether living standards will continue to rise at the accelerated pace of the late 1990s.
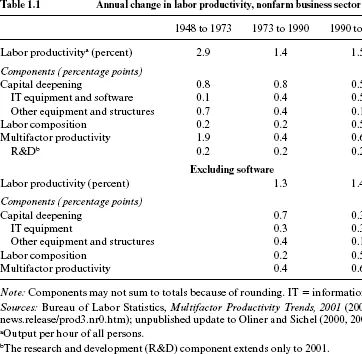
The “sources of growth” model has been the main empirical tool in tracking and explaining growth trends. This model, developed in the 1950s and 1960s by Solow (1956, 1957, 1960), Kendrick (1961), Denison (1962, 1964), Jorgenson and Griliches (1967, 1972), and others, allocates the growth rate of measured output to the growth rate of labor and capital inputs, each weighted by their share of output, and a residual factor associated with the efficiency with which output is produced from a given set of inputs (“total factor productivity,” or TFP). A large academic literature has evolved using this framework, reviewed recently in Hulten (2001), and TFP has become an official statistic produced regularly by the Bureau of Labor Statistics (BLS). An updated version of the BLS decomposition is shown in the upper half of table 1.1, which indicates that output per hour worked rose about 1.25 percentage points per year faster since 1995 than it did during the period of lackluster growth from 1973 until then. These figures have lent support to the “new economy” view about prospective growth trends.
Although great progress has been made in applying the sources-of-growth framework to the analysis of economic growth, doubts have nevertheless been raised about our ability to understand and measure fully the fundamental sources of growth. For example, despite several decades of rapid technological advance in information technology, one of the originators of the sources-of-growth model, Robert Solow, famously remarked in 1987 that “you see the computer revolution everywhere except in the productivity data” (Solow 1987). Alan Greenspan observed about ten years later that many services industries displayed implausibly negative trends in measured productivity despite being among the top computer-using industries.1 Also, Nordhaus (1997) concluded from his analysis of the history of lighting that official price and output data “miss the most important technological revolutions in history.” The recent debate over the accuracy of the consumer price index (CPI) has raised similar questions: Studies have shown that the failure to capture the full effect of improvements in product quality and the benefits of new goods and services created an upward bias in the CPI of more than 0.5 percentage point (Lebow, Roberts, and Stockton 1994; Advisory Commission to Study the Consumer Price Index 1996; Shapiro and Wilcox 1996) and implied a corresponding downward bias in the rate of increase in the consumption component of total real output.
Some of the foregoing concerns can be traced to problems inherent in the data used to study economic growth, but many key data concerns have been addressed in relatively recent work at the major statistical agencies. These include, among others, the renewed emphasis on quality change in the measurement of prices at the BLS, the capitalization of software expenditures by the Bureau of Economic Analysis (BEA), and the expanded coverage of service industries by the Census Bureau. However, no parallel theoretical advance has emerged, within or beyond the sources-of-growth framework, to guide further empirical advances and tell us what we need to know to understand economic growth in the “new economy.”
The first goal of this paper is to expand the conceptual framework of the sources-of-growth model by linking it to a variant of the standard model of intertemporal choice developed in Hulten (1979). In the expanded framework, the determination of what expenditures are current consumption and what are capital investment is governed by consumer utility maximization, and any outlay that is intended to increase future rather than current consumption is treated as a capital investment. When this deferred-consumption rule is applied to one of the most important “new economy” questions—whether business intangible outlays and knowledge input should be expensed or capitalized in national accounting systems—an unambiguous answer is obtained: there is no basis from the consumers’ point of view for treating investments in intangible capital differently from investments in plant and equipment, or tangible capital.2
We then turn to the question of how much difference the theoretically appropriate treatment of intangible capital might make to the productivity estimates shown in table 1.1. Competing approaches have emerged in the current literature on the measurement of intangibles. One prominent approach uses the value of securities, primarily stocks, to infer the quantity of intangible capital held by U.S. corporations to help interpret recent changes in productivity (R. Hall 2000, 2001a,b).3 Our work, however, follows another branch of the literature. Rather than appealing to the stock market, we pull together disparate pieces of spending data and related evidence to gauge the plausible magnitude of the additional business investment (and thus gross domestic product [GDP] and output per hour) if expenditures on intangibles, or knowledge capital, are treated symmetrically with investments in traditional fixed capital. The estimates we develop build on the studies by Nakamura and others who have examined the undervaluation of measured business investment and capital in the late 1990s (Nakamura 1999, 2001, 2003; Brynjolffson and Yang 1999; Brynjolffson, Hitt, and Yang 2002; McGratten and Prescott 2000), as well as earlier work sponsored by the Organization for Economic Cooperation and Development (OECD; OECD Secretariat 1998).
Our effort differs from previous work, however, by applying the theoretical classification and accounting principles that follow from the expanded framework we introduce in the next section. Not only does this framework lead us to cast a wider net to identify the possible components of business investment in intangibles, but it also leads us to distinguish spending flows that generate relatively long-lasting revenue streams from those whose returns dissipate too quickly to count the associated asset as fixed capital. The latter consideration has not been an explicit aspect of others’ efforts to gauge the plausible undervaluation of business investment. We also are careful to separate assets that are already included in the national accounts from those that are not.
All told, our framework for the economic measurement of capital suggests that, if business intangibles are fully recognized in national accounting systems, the move will significantly change measures of economic activity. We estimate that business spending on long-lasting knowledge capital—including intangibles broadly—grew relative to other major components of aggregate demand during the 1990s. As a result, our estimates show that, by the end of the decade, business fixed investment in intangibles was at least as large as business investment in traditional, tangible capital. When the unrecognized portion of this spending is viewed in relation to existing measures, our framework portrays the U.S. economy as having had higher gross private saving and, under plausible assumptions, fractionally higher average annual rates of change in real output and real output per hour, particularly from 1995 to 2002.
1.2 Theory
1.2.1 The Production Function Approach to Growth Accounting
Contemporary growth accounting is organized around the concept of the aggregate production function. Aggregate real output is assumed to be related to inputs of labor and capital via an aggregate production function, with provision for changes in the productivity of the inputs. When efficiency change has the Hicks-neutral form, the production function can be expressed as
where Qt denotes real output, Kt and Lt are capital and labor, and At is an index of the level of TFP. In econometric studies of growth, the production function is given a specific parametric form, and the parameters of F (·) are then estimated using a variety of techniques. In the index-number (non-parametric) approach of Solow (1957) and Jorgenson and Griliches (1967), the growth rate of output is equal to the shared-weight growth rates of labor and capital:
(The g terms are growth rates, and the s terms are factor shares.) Under constant returns to scale and marginal-cost pricing, Solow showed that the factor shares are equivalent to output elasticities, and the term gA was associated with a shift in the production function in equation (1) (illustrated as the move from a to c in figure 1.1), while sKgK + sLgL was a movement along the function (c to b in the figure). Each item in equation (2) can, in principle, be estimated from national accounting data, except for the growth rate of TFP, gA, which must be inferred as a residual—Abramovitz's famous “measure of our ignorance.”
The sources-of-growth equation is the basis for the estimates in table 1.1, which are expressed in labor-productivity terms: gQ − gL = sK (gK − gL) + gA.4 The estimates in this table highlight the slowdown in productivity growth in the early 1970s and the pickup in the mid-1990s. The table also reveals the important role played by TFP in these swings in productivity growth. The acceleration in labor productivity since 1995 has generated the “new economy” view that the U.S. economy has entered an era of higher productivity growth. As can be seen in the table, the 1.25 percentage point improvement in labor productivity growth after 1995 was driven both by a pickup in TFP and by the increased capital deepening of information technology (IT) equipment and software.5
The potential importance of investment in intangible assets is borne out by the lower panel of table 1.1, in which the sources of growth estimates exclude the effect of capitalized software (i.e., they exclude investment in software as a component of both output and capital input). Here the pickup in labor productivity growth is seen to be only about 1 percentage point, about one-quarter percentage point less than when software is included.
These results for software point to the potential importance of capitalizing other intangibles, like R&D. In the treatment shown in the upper panel of table 1.1 (the part taken from the BLS release), R&D is added as a “memo” item explaining a portion of the residual; it does not play an explicit role as a capital input. Unfortunately, the traditional sources-of-growth framework treats capital and labor inputs as determined outside of the framework and therefore does not provide guidance as to whether to treat R&D as a memo item or as an investment good and thus as part of output. This proble...