eBook - ePub
Predictive Analytics, Data Mining and Big Data
Myths, Misconceptions and Methods
S. Finlay
This is a test
- English
- ePUB (adapté aux mobiles)
- Disponible sur iOS et Android
eBook - ePub
Predictive Analytics, Data Mining and Big Data
Myths, Misconceptions and Methods
S. Finlay
Détails du livre
Aperçu du livre
Table des matières
Citations
À propos de ce livre
This in-depth guide provides managers with a solid understanding of data and data trends, the opportunities that it can offer to businesses, and the dangers of these technologies. Written in an accessible style, Steven Finlay provides a contextual roadmap for developing solutions that deliver benefits to organizations.
Foire aux questions
Comment puis-je résilier mon abonnement ?
Il vous suffit de vous rendre dans la section compte dans paramètres et de cliquer sur « Résilier l’abonnement ». C’est aussi simple que cela ! Une fois que vous aurez résilié votre abonnement, il restera actif pour le reste de la période pour laquelle vous avez payé. Découvrez-en plus ici.
Puis-je / comment puis-je télécharger des livres ?
Pour le moment, tous nos livres en format ePub adaptés aux mobiles peuvent être téléchargés via l’application. La plupart de nos PDF sont également disponibles en téléchargement et les autres seront téléchargeables très prochainement. Découvrez-en plus ici.
Quelle est la différence entre les formules tarifaires ?
Les deux abonnements vous donnent un accès complet à la bibliothèque et à toutes les fonctionnalités de Perlego. Les seules différences sont les tarifs ainsi que la période d’abonnement : avec l’abonnement annuel, vous économiserez environ 30 % par rapport à 12 mois d’abonnement mensuel.
Qu’est-ce que Perlego ?
Nous sommes un service d’abonnement à des ouvrages universitaires en ligne, où vous pouvez accéder à toute une bibliothèque pour un prix inférieur à celui d’un seul livre par mois. Avec plus d’un million de livres sur plus de 1 000 sujets, nous avons ce qu’il vous faut ! Découvrez-en plus ici.
Prenez-vous en charge la synthèse vocale ?
Recherchez le symbole Écouter sur votre prochain livre pour voir si vous pouvez l’écouter. L’outil Écouter lit le texte à haute voix pour vous, en surlignant le passage qui est en cours de lecture. Vous pouvez le mettre sur pause, l’accélérer ou le ralentir. Découvrez-en plus ici.
Est-ce que Predictive Analytics, Data Mining and Big Data est un PDF/ePUB en ligne ?
Oui, vous pouvez accéder à Predictive Analytics, Data Mining and Big Data par S. Finlay en format PDF et/ou ePUB ainsi qu’à d’autres livres populaires dans Betriebswirtschaft et Unternehmensstrategie. Nous disposons de plus d’un million d’ouvrages à découvrir dans notre catalogue.
Informations
Sujet
BetriebswirtschaftSous-sujet
Unternehmensstrategiechapter 1
Introduction
Retailers, banks, governments, social networking sites, credit reference agencies and telecoms companies, amongst others, hold vast amounts of information about us. They know where we live, what we spend our money on, who our friends and family are, our likes and dislikes, our lifestyles and our opinions. Every year the amount of electronic information about us grows as we increasingly use internet services, social media and smart devices to move more and more of our lives into the online environment.
Until the early 2000s the primary source of individual (consumer) data was the electronic footprints we left behind as we moved through life, such as credit card transactions, online purchases and requests for insurance quotations. This information is required to generate bills, keep accounts up to date, and to provide an audit of the transactions that have occurred between service providers and their customers. In recent years organizations have become increasingly interested in the spaces between our transactions and the paths that led us to the decisions that we made. As we do more things electronically, information that gives insights about our thought processes and the influences that led us to engage in one activity rather than another has become available. A retailer can gain an understanding of why we purchased their product rather than a rival’s by examining what route we took before we bought it – what websites did we visit? What other products did we consider? Which reviews did we consult? Similarly, social media provides all sorts of information about ourselves (what we think, who we talk to and what we talk about), and our phones and other devices provide information about where we are and where we’ve been.
All this information about people is incredibly useful for all sorts of different reasons, but one application in particular is to predict future behavior. By using information about people’s lifestyles, movements and past behaviors, organizations can predict what they are likely to do, when they will do it and where that activity will occur. They then use these predictions to tailor how they interact with people. Their reason for doing this is to influence people’s behavior, in order to maximize the value of the relationships that they have with them.
In this book I explain how predictive analytics is used to forecast what people are likely to do and how those forecasts are used to decide how to treat people. If your organization uses predictive analytics; if you are wondering whether predictive analytics could improve what you do; or if you want to find out more about how predictive models are constructed and used in practical real-world environments, then this is the book for you.
1.1 What are data mining and predictive analytics?
By the 1980s many organizations found themselves with customer databases that had grown to the point where the amount of data they held had become too large for humans to be able to analyze it on their own. The term “data mining” was coined to describe a range of automated techniques that could be applied to interrogate these databases and make inferences about what the data meant. If you want a concise definition of data mining, then “The analysis of large and complex data sets” is a good place to start.
Many of the tools used to perform data mining are standard statistical methods that have been around for decades, such as linear regression and clustering. However, data mining also includes a wide range of other techniques for analyzing data that grew out of research into artificial intelligence (machine learning), evolutionary computing and game theory.
Data mining is a very broad topic, used for all sorts of things. Detecting patterns in satellite data, anticipating stock price movements, face recognition and forecasting traffic congestion are just a few examples of where data mining is routinely applied. However, the most prolific use of data mining is to identify relationships in data that give an insight into individual preferences, and most importantly, what someone is likely to do in a given scenario.
This is important because if an organization knows what someone is likely to do, then it can tailor its response in order to maximize its own objectives. For commercial organizations the objective is usually to maximize profit.
However, government and other non-profit organizations also have reasons for wanting to know how people are going to behave and then taking action to change or prevent it. For example, tax authorities want to predict who is unlikely to file their tax return correctly, and hence target those individuals for action by tax inspectors. Likewise, political parties want to identify floating voters and then nudge them, using individually tailored communications, to vote for them. Sometime in the mid-2000s the term “predictive analytics” became synonymous with the use of data mining to develop tools to predict the behavior of individuals (or other entities, such as limited companies). Predictive analytics is therefore just a term used to describe the application of data mining to this type of problem.
Predictive analytics is not new. One of the earliest applications was credit scoring,1 which was first used by the mail order industry in the 1950s to decide who to give credit to. By the mid-1980s credit scoring had become the primary decision-making tool across the financial services industry. When someone applies to borrow money (to take out a loan, a credit card, a mortgage and so on), the lender has to decide whether or not they think that person will repay what they borrow. A lender will only lend to someone if they believe they are creditworthy. At one time all such decisions were made by human underwriters, who reviewed each loan application and made a decision based on their expert opinion. These days, almost all such decisions are made automatically using predictive model(s) that sit within an organization’s application processing system.
To construct a credit scoring model, predictive analytics is used to analyze data from thousands of historic loan agreements to identify what characteristics of borrowers were indicative of them being “good” customers who repaid their loans or “bad” customers who defaulted. The relationships that are identified are encapsulated by the model. Having used predictive analytics to construct a model, one can then use the model to make predictions about the future repayment behavior of new loan applicants. If you live in the USA, you have probably come across FICO scores, developed by the FICO Corporation (formerly Fair Isaac Corporation), which are used by many lending institutions to assess applications for credit. Typically, FICO scores range from around 300 to about 850.2 The higher your score the more creditworthy you are. Similar scores are used by organizations the world over. An example of a credit scoring model (sometimes referred to as a credit scorecard) is shown in Figure 1.1.
To calculate your credit score from the model in Figure 1.1 you start with the constant score of 670. You then go through the scorecard one characteristic at a time, adding or subtracting the points that apply to you,3 so, if your employment status is full-time you add 28 points to get 698. Then, if your time in current employment is say, two years, you subtract 10 points to get 688. If your residential status is Home Owner you then add 26 points to get 714, and so on.
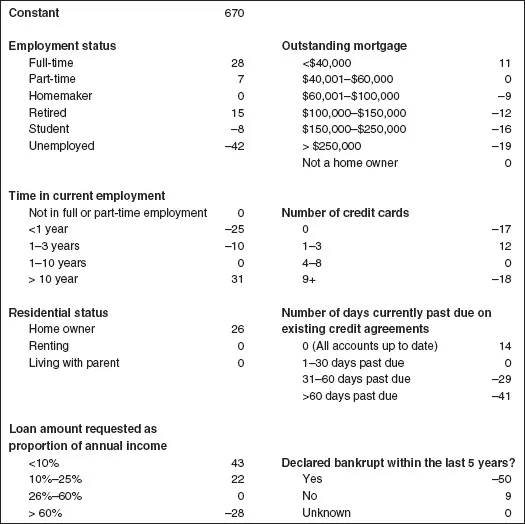
Figure 1.1 Loan application model
What does the score mean? For a credit scoring model the higher the score the more likely you are to repay the loan. The lower the score the more likely you are to default, resulting in a loss for the lender. To establish the relationship between score and behavior a sample of several thousand completed loan agreements where the repayment behavior is already known is required. The credit scores for these agreements are then calculated and the results used to generate a score distribution as shown in Figure 1.2.
The score distribution shows the relationship between people’s credit score and the odds of them defaulting. At a score of 500 the odds are 1:1. This means that on average half of those who score 500 will default if they are granted a loan. Similarly, for those scoring 620 the odds are 64:1; i.e. if you take 65 borrowers that score 620, the expectation is that 64 will repay what they borrow, but one will not.
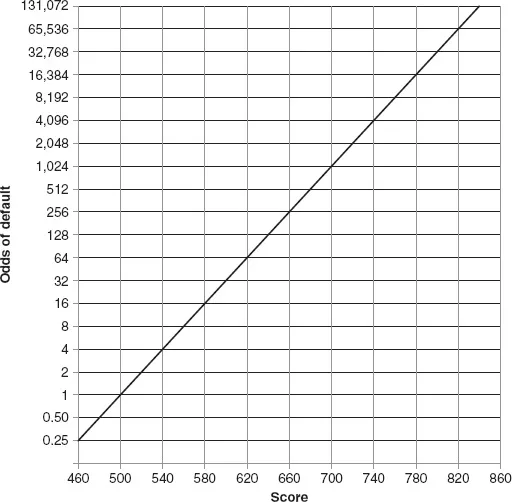
Figure 1.2 Score distribution
To make use of the score distribution in Figure 1.2 you need to have a view about the profitability of loan customers. Let’s assume that we have done some analysis of all loan agreements that completed in the last 12 months. This tells us that the average profit from each good loan customer who repaid their loan was $500, but the average loss when someone defaulted was $8,000. From these figures it is possible to work out that we will only make money if there are at least 16 good customers for every one that defaults ($8,000/$500 = 16). This translates into a business decision to offer a customer a loan only if the odds of them being good are more than 16:1. You can see from the score distribution graph that this equates to a cut-off score of 580. Therefore, we should only grant loans to applicants who score more than 580 and decline anything that scores 580 or less. So given the model in Figure 1.1, do you think that you would get a loan?
An absolutely fundamental thing to understand about a predictive model like this is that we are talking about probability, not certainty. Just like a human decision maker, no model of consumer behavior gets it right every time. We are making a prediction, not staring into a crystal ball. Whatever score you get does not determine precisely what you will do. Scoring 800 doesn’t mean you won’t default, only that your chance of defaulting is very low (1 in 32,768 to be precise). Likewise, for people scoring 560 the expectation is that eight out of every nine will repay – still pretty good odds, but this isn’t a pure enough pot of good customers to lend profitability based on an average profit of $500 and an average loss of $8,000. It’s worth pointing out that although the credit industry talks about people in terms of being “creditworthy” or “uncreditworthy,” in reality most of those deemed uncreditworthy would actually repay a loan if they were granted one.
Some other important things to remember when talking about credit scoring models (and predictive models in general):

1.2 How good are models at predicting behavior?
In one sense, most predictive models are quite poor at predicting how someone is going to behave. To illustrate this, let’s think about a traditional paper-based mail shot. Although in decline, mail shots remain a popular tool employed by marketing professionals to promote products and services to consumers. Consider an insurance company with a marketing strategy that involves sending mail shots to people offering them a really good deal on life insurance. The company uses a response model to predict who is most likely to want life insurance, and these people are mailed.
If the model is a really good one, then the company might be able to identify people with a 1 in 10 chance of taking up the offer – 10 out of every 100 people who are mailed respond. To put it another way, the model will get it right only 10% of the time and get it wrong 90% of the time. That’s a pretty high failure rate! However, what you need to consider is what would happen without the model. If you select people from the phone book at random, then a response rate of around 1% is fairly typical for a mail shot of this type. If you look at it this way, then the model is ten times better than a purely random approach – which is not bad at all.
In a lot of ways we are in quite a good place when it comes to predictive models. In many organizations across many industries, predictive models are generating useful predictions and are being used to significantly enhance what those organizations are doing. There is also a rich seam of new applications to which predictive analytics can be applied. However, most models are far from perfect, and there is lots of scope for improvement. In recent years, there have been some improvements in the algorithms that generate predictive models, but these improvements are relatively small compared to the benefits of having more data, better quality data and analyzing this data more effectively. This is the main reason why Big Data is considered such a prize for those organizations that can utilize it.
1.3 What are the benefits of predictive models?
In many walks of life the traditional approach to decision making is for experts in that field to make decisions based on their expert opinion. Continuing...
Table des matières
- Cover
- Title
- Copyright
- Contents
- List of figures and tables
- Acknowledgments
- 1 Introduction
- 2 Using Predictive Models
- 3 Analytics, Organization and Culture
- 4 The Value of Data
- 5 Ethics and Legislation
- 6 Types of Predictive Models
- 7 The Predictive Analytics Process
- 8 How to Build a Predictive Model
- 9 Text Mining and Social Network Analysis
- 10 Hardware, Software and All that Jazz
- Appendix A. Glossary of Terms
- Appendix B. Further Sources of Information
- Appendix C. Lift Charts and Gain Charts
- Notes
- Index
Normes de citation pour Predictive Analytics, Data Mining and Big Data
APA 6 Citation
Finlay, S. (2014). Predictive Analytics, Data Mining and Big Data ([edition unavailable]). Palgrave Macmillan UK. Retrieved from https://www.perlego.com/book/3489869/predictive-analytics-data-mining-and-big-data-myths-misconceptions-and-methods-pdf (Original work published 2014)
Chicago Citation
Finlay, S. (2014) 2014. Predictive Analytics, Data Mining and Big Data. [Edition unavailable]. Palgrave Macmillan UK. https://www.perlego.com/book/3489869/predictive-analytics-data-mining-and-big-data-myths-misconceptions-and-methods-pdf.
Harvard Citation
Finlay, S. (2014) Predictive Analytics, Data Mining and Big Data. [edition unavailable]. Palgrave Macmillan UK. Available at: https://www.perlego.com/book/3489869/predictive-analytics-data-mining-and-big-data-myths-misconceptions-and-methods-pdf (Accessed: 15 October 2022).
MLA 7 Citation
Finlay, S. Predictive Analytics, Data Mining and Big Data. [edition unavailable]. Palgrave Macmillan UK, 2014. Web. 15 Oct. 2022.