eBook - ePub
Mergers and Acquisitions in Asia
Roger Y. W. Tang, Ali M. Metwalli
This is a test
- 240 pages
- English
- ePUB (adapté aux mobiles)
- Disponible sur iOS et Android
eBook - ePub
Mergers and Acquisitions in Asia
Roger Y. W. Tang, Ali M. Metwalli
Détails du livre
Aperçu du livre
Table des matières
Citations
À propos de ce livre
This book examines recent trends towards mergers and acquisitions in Japan, Greater China and Southeast Asia from 1990 to 2004. Comparisons are made among regions and between countries of particular regions.
The economic profiles and investment climates ofkey countriesare discussed and many issuesare examined from the perspectives of US-based and UK-based investors because they play significant roles in Mergers and Acquisitionsactivities in all regions of the world.
The practices and management strategies in Asiaare alsocompared with those observed in the United States and the United Kingdom where appropriate.
Foire aux questions
Comment puis-je résilier mon abonnement ?
Il vous suffit de vous rendre dans la section compte dans paramètres et de cliquer sur « Résilier l’abonnement ». C’est aussi simple que cela ! Une fois que vous aurez résilié votre abonnement, il restera actif pour le reste de la période pour laquelle vous avez payé. Découvrez-en plus ici.
Puis-je / comment puis-je télécharger des livres ?
Pour le moment, tous nos livres en format ePub adaptés aux mobiles peuvent être téléchargés via l’application. La plupart de nos PDF sont également disponibles en téléchargement et les autres seront téléchargeables très prochainement. Découvrez-en plus ici.
Quelle est la différence entre les formules tarifaires ?
Les deux abonnements vous donnent un accès complet à la bibliothèque et à toutes les fonctionnalités de Perlego. Les seules différences sont les tarifs ainsi que la période d’abonnement : avec l’abonnement annuel, vous économiserez environ 30 % par rapport à 12 mois d’abonnement mensuel.
Qu’est-ce que Perlego ?
Nous sommes un service d’abonnement à des ouvrages universitaires en ligne, où vous pouvez accéder à toute une bibliothèque pour un prix inférieur à celui d’un seul livre par mois. Avec plus d’un million de livres sur plus de 1 000 sujets, nous avons ce qu’il vous faut ! Découvrez-en plus ici.
Prenez-vous en charge la synthèse vocale ?
Recherchez le symbole Écouter sur votre prochain livre pour voir si vous pouvez l’écouter. L’outil Écouter lit le texte à haute voix pour vous, en surlignant le passage qui est en cours de lecture. Vous pouvez le mettre sur pause, l’accélérer ou le ralentir. Découvrez-en plus ici.
Est-ce que Mergers and Acquisitions in Asia est un PDF/ePUB en ligne ?
Oui, vous pouvez accéder à Mergers and Acquisitions in Asia par Roger Y. W. Tang, Ali M. Metwalli en format PDF et/ou ePUB ainsi qu’à d’autres livres populaires dans Commerce et Commerce Général. Nous disposons de plus d’un million d’ouvrages à découvrir dans notre catalogue.
Informations
1 Mergers and acquisitions in a changing world
Mergers and Acquisitions (M&A) is a process or a range of activities for two companies to combine their operations to achieve specific business or strategic objectives. These objectives may include expanding into new products or markets, reducing production or administrative costs, and adding new research and development capabilities to the combined company. Cross-border M&A may allow the acquirer to expand into overseas markets and obtain new technology and brand names, or distribution networks.
M&A activities expanded rapidly in the United States and Europe during the 1990s. The M&A transaction value in the United States reached its peak of $2.3 trillion in 1999. In Britain, the M&A transaction value also reached a record of $802 billion in 1999. In Germany, its M&A record in 1999 was $518 billion. Unfortunately, the M&A boom in the 1990s was followed by a slow-down of the global economy and the stock market crash in the second half of the 1990s. The 9/11 tragedy in September 2001 and the recession in 2001 and 2002 also depressed worldwide M&A activities. M&A transaction values in the United States and Europe plummeted in 2002 and 2003.
In the last two decades, many writers have published hundreds of articles and dozens of books to explain the M&A activities in the United States and Europe. Some papers and books have also been published to explain cross-border M&A in Asia. For example, Zhan and Ozawa (2001) provide a comprehensive review of cross-border transactions in Indonesia, Malaysia, the Philippines, Thailand, and South Korea up to 1999. Mody and Negishi (2001), and Chen and Findlay (2003) reviewed the cross-border mergers and acquisitions in Asia up to the year 2000 and discussed their impact on the host economies in that region.
Chen and Findlay (2003) concluded that the rapid increase in cross-border M&A in the APEC economies in the 1990s was “driven by a combination of factors, including the liberalization of trade and investment regimes, the deregulation of the service sector, the privatization of state-owned enterprises (SOEs), and the relaxation of controls over cross-border M&As.” These factors continue to impact M&A activities in the twenty-first century. Other factors including the economic expansion in China and the economic integration among the three regions of Greater China (Hong Kong, Taiwan, and Mainland China) also have significant impact on the M&A activities in East Asia. The main purpose of this book is to provide a comprehensive review of M&A activities in selected countries in Asia. These countries include Japan, Hong Kong, Taiwan, China, and selected countries in the ASEAN (Association of Southeast Asian Nations) region.
In the remainder of this chapter, we will discuss the following topics:
- global trends of M&A in industrial countries, Greater China, and the ASEAN region;
- cross-border M&A from a US perspective;
- the importance of East and Southeast Asia in global investment and trade;
- economic growth of developing countries in Asia;
- recent changes in the Asian-Pacific region that facilitate the expansion of M&A;
- the objectives and scope of this book.
An overview of the book is provided toward the end of this chapter.
Global trends of M&A
In the past, M&A activities in the United States and many other industrial countries included some periods of high merger activities (merger waves) followed by periods of relatively fewer activities. Many writers agree there have been five waves of M&A in the United States since 1890 (e.g. Weston and Weaver, 2001; Gaughan, 2003; Sudarsanam, 2003). However, they disagree slightly on the beginning and ending years of those five merger waves. Table 1.1 summarizes the views of three books: Weston and Weaver (2001), Sudarsanam (2003), and Gaughan (2003). Major characteristics of each of those five merger waves are also provided in Table 1.1. Detailed discussions can be found in Gaughan (2003), Sudarsanam (2003), Gilson and Black (1995), Salter and Weinhold (1979), and many other publications. Some major outcomes from these waves are summarized as follows:
- The first wave (1890–1905): Many horizontal mergers took place during this wave. Industrial giants such as General Electric, Eastman Kodak, American Can, American Tobacco, and DuPont were established through consolidations.
- The second wave (1920s): This wave was characterized by an increase in vertical mergers and a movement toward oligopolistic structure in some industries. According to Sudarsanam (2003), “the second wave accompanied economic growth and stock market boom. An estimated 12,000 firms disappeared during the period.”
- The third wave (1960s): During this period, there were many unrelated mergers to achieve growth through diversification into new product markets. This wave ended with the petroleum crisis in 1973 and the economic recession that followed.
- The fourth wave (1980s): This wave witnessed many financial innovations including junk bonds and leveraged buyout (LBO) that made many firms vulnerable to hostile tender offers. This wave included acquisitions as well as divestitures that allowed companies to sell off some segments of their businesses.
- The fifth wave (1990s): This period witnessed the emergence and widespread use of many new technologies including the Internet, cable television, and satellite communication. Globalization of production, sales, and capital markets had also accelerated. Mature industries such as banking, automobiles, pharmaceuticals, and media were being downsized and restructured. M&A of the fifth wave reached its peak in 1999 with a worldwide M&A value of about $4.4 trillion, before declining to $3.9 trillion in 2000.
Table 1.1 Five waves of M&A activities in the United States from 1893 to 2004
Historical reviews of M&A activities among member countries of the European Union (EU) and merger waves of the United Kingdom (UK) are provided in Sudarsanam (2003) who noted there were two merger waves among the EU. One small wave occurred from 1987 to 1992 and a much larger one existed from 1995 to 2001. These two merger waves almost parallel those of the fourth and fifth waves of the United States. Sudarsanam (2003) also found that the EU countries most active in M&A in the 1990s were the United Kingdom (31 percent of all EU deals), Germany (16 percent), France (14 percent), the Netherlands (7 percent), and Italy (6 percent).
In reviewing the merger waves in the United Kingdom, Sudarsanam (2003) discovered that “there is a striking parallel in the incidence and timing of the 1960s and 1980s waves in the US and the UK,” and the UK merger wave in the 1990s “shares many of the characteristics of the 1990s wave in the EU.”
Since the focus of this book is on M&A activities from 1990 to 2004, we will provide more discussion of the fifth wave and other global trends for that period. In the following sections, we will review recent worldwide M&A aggregate statistics, M&A in selected industrial countries and those in Greater China and the ASEAN region.
Worldwide M&A activities
Table 1.2 shows the announced worldwide M&A activity from 1990 to 2004. The table includes statistics on the number of deals, total M&A value, and average value per deal. The value of M&A transactions listed is limited to those with one million dollars or higher.
Table 1.2 Announced worldwide M&A activity, 1990–2004
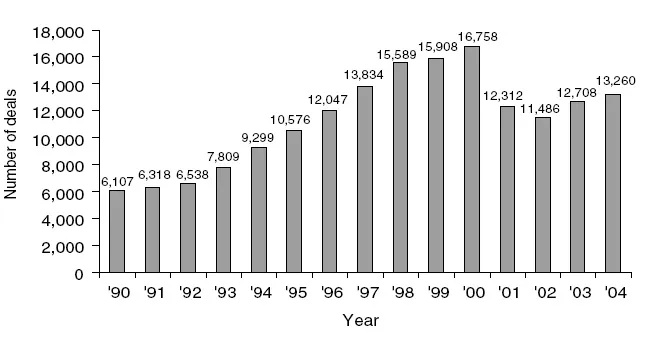
Figure 1.1 Worldwide M&A activity in number of deals, 1990–2004.
Source: Thomson Financial.
In 1990, there were 6,107 deals worldwide. The number of deals increased moderately in 1991 and 1992. Between 1993 and 1998, the number of deals recorded double-digit increases each year before slowing down in 1999. The number of deals reached its peak in 2000 and declined substantially in 2001 and 2002 before recovering in 2003. The changes in worldwide M&A transactions are also depicted in Figure 1.1. In 2004, there were 13,260 deals with values of US$ 1 million or higher.
As shown in Table 1.2, total M&A value declined by 25 percent from 1990 to 1991. It recorded a moderate increase of 4 percent in 1992. The fifth merger wave took place between 1992 and 2000. During this period, the annual worldwide total M&A value increased from $503 billion in 1992 to $4.4 trillion in 1999 before dropping to $3.9 trillion in 2000. Total M&A value declined substantially in 2001 and 2002. In 2002, the worldwide total of M&A value was about $1.4 trillion. The year 2003 witnessed a slow recovery of M&A activity, and total M&A value recorded an impressive gain of 42 percent in 2004. In 2004, worldwide total M&A value was about $2.1 trillion. Changes in worldwide M&A value from 1990 to 2004 are also shown in Figure 1.2.
The last column of Table 1.2 shows the average value per deal from 1990 to 2004. The average value fluctuated from $76.5 million in 1991 to $279.6 million in 1999. In 2004, the average value per deal was $174.9 million.
M&A activities in selected developed countries
Table 1.3 shows the announced M&A deals in eight selected industrial countries from 1990 to 2004. These countries are the United States, the United Kingdom, Japan, France, Germany, Italy, the Netherlands, and Sweden. During the period from 1990 to 2004, the United States had a total of 76,944 announced deals and accounted for about 45 percent of the world’s total as shown in Table 1.3. The British share of M&A for the same period was about 15 percent. Together, the United States and Britain accounted for 60 percent of worldwide M&A from 1990 to 2004.
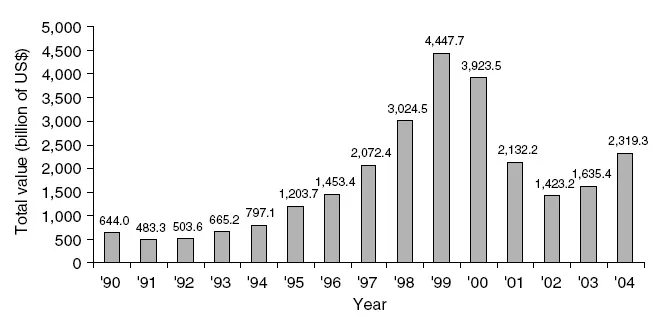
Figure 1.2 Worldwide M&A activity in transaction value, 1990–2004.
Source: Thomson Financial.
Table 1.3 Announced M&A deals in selected industrial countriesa, 1990–2004
Japan witnessed a remarkable growth in announced M&A deals from 1990 to 2004. In 1990, the announced M&A deals of $1 million or above were only 286. The number declined to 91 in 1994. Between 1995 and 2003, the number of deals increased from 126 to 1,379. In 2004, it decreased to 1,225. During the 1990–2004 period, Japan had a total of 6,213 deals, or about 4 percent of the world’s total. Details of Japan’s M&A activities will be provided in Chapter 3. France, Germany, Italy, the Netherlands, and Sweden are all member countries of the EU with significant M&A deals. Together, these five countries had about 12 percent of worldwide M&A deals.
Table 1.4 provides the statistics of M&A transaction values for the eight industrial countries from 1990 to 2004. In most of these countries, the fifth merger wave began in 1993 and ended in 2001. M&A transaction values of these countries reached their peaks in 1999. During 1999, the United States had a record transaction value of $2.3 trillion, while Britain also had a record of $802 billion in the same year. Between 2001 and 2003, M&A transaction values plummeted in many industrial countries. This trend coincided with the recession and stock market crash in the same period. The year 2004 witnessed a recovery of M&A transactions in most of these eight countries.
From 1990 to 2004, the United States had a total M&A transaction value of $14.8 trillion, or 55 percent of the world’s total. Britain’s total for the same period was $3.9 trillion, accounting for 15 percent of the world’s total. Together, the United States and Britain had about 70 percent of the worldwide total M&A transaction value from 1990 to 2004. The other six industrial countries also had significant M&A transaction values during the same period.
Table 1.5 shows the twenty largest worldwide M&A during the 1990–2004 period. The largest transaction ($202.8 billion) was the takeover of Mannesmann AG (Germany) by Vodafone Airtouch PLC (UK). The merger between Time Warner and America Online was second with a transaction value of $164.7 billion. The third largest deal was the acquisition of Warner-Lambert by Pfizer in 1999 that had a transaction value of $89.2 billion.
All the acquirers and target companies of the twenty largest M&A were from industrial countries. Fourteen US companies were involved as acquirers and another 15 US firms as target companies. Three British companies were involved in three transactions as acquirers and another British firm (SmithKline Beecham) was involved as a target company. Other countries that had companies involved as acquirers or targets in the top 20 deals are France, Canada, and Germany.
Table 1.6 shows the 30 largest worldwide M&A in 2005. The largest transaction was the acquisition of Gillette by Proctor & Gamble in a $54.9 billion deal. The second largest transaction was the purchase of Mitsubishi Tokyo Financial by UFJ Holdings in Japan. The acquisition of MBNA by Bank of America was the third largest deal. The other 27 deals ranged in value from $7.6 billion to $35.4 billion.
Table 1.4 Announced M&A transaction values in selected industrial countriesa, 1990–2004 (value in millions of US dollars)
Table 1.5 Twenty largest worldwide M&A deals, 1990–2004
Table 1.6 Thirty largest worldwide M&A in 2005
Of the 30 largest deals, 11 were still pending as of March 1, 2006. Preliminary statistics fromThomson Financial also showthat totalworldwideM&Atransaction value for 2005 was more than $2.7 trillion, and the number of deals worldwide increased by 38 percent compared with 2004.
M&A activities in Greater China
In this book, Greater China is defined to include Hong Kong, Taiwan, and Mainland China. In the past, many authors have used this definition to discuss the economic growth, economic integration, and cultural aspects of Mainland China, Hong Kong, and Taiwan (e.g. Ash and Kueh, 1993; Ho and Tsui, 2004; and Sung, 2005). Details on investment and trade relations among the three regions of Greater China will be presented in Chapter 4. In Chapter 1, we will provide the aggregate statistics of M&A in Greater China. Details of M&A by region (or country) of Greater China will be discussed in Chapter 5.
Table 1.7 shows the announced M&A deals and transaction values of Greater China from 1990 to 2004. The number of deals increased rapidly from a low of 131 deals in 1990 to 2,195 deals in 2004. In recent years (2000–4), the average number of deals per year (1,417 deals) surpassed those in the first half and second half of the 1990s.
The M&A transaction values in Greater China had fluctuated from a low of $10.3 billion in 1990 to $167.1 billion in 2000. The transaction value dropped by 59 percent in 2001 before recovering a bit in 2002. In 2004, the annual transaction value was $56.4 billion.
The total M&A transaction value of Greater China from 1990 to 2004 was $675.2 billion, accounting for about 3 percent of the worldwide total. The average value per deal for the 1990–2004 period was about $60.9 million. Annual average value per deal varies significantly from year to year.
Table 1.7 Announced M&A deals and transaction values in Greater China, 1990–2004
M&A activities in the ASEAN region
For the purpose of this book, the ASEAN region is defined to include the ten member countries of the Association: Brunei, Myanmar (Burma), Cambodia, Laos, Malaysia, Singapore, Thailand, Indonesia, the Philippines, and Vietnam. In...
Table des matières
- Cover Page
- Title Page
- Copyright Page
- Figures
- Tables
- Preface
- Acknowledgments
- 1 Mergers and acquisitions in a changing world
- 2 Economic environment of Japan
- 3 Merger and acquisition activity in Japan
- 4 Greater China and its investment and trade relations with the United States
- 5 Mergers and acquisitions in Greater China
- 6 The economic environment of Southeast Asian countries
- 7 Mergers and acquisitions in Southeast Asia
- 8 Cross-national comparisons and general conclusions
- Bibliography
Normes de citation pour Mergers and Acquisitions in Asia
APA 6 Citation
Tang, R., & Metwalli, A. (2006). Mergers and Acquisitions in Asia (1st ed.). Taylor and Francis. Retrieved from https://www.perlego.com/book/714741/mergers-and-acquisitions-in-asia-pdf (Original work published 2006)
Chicago Citation
Tang, Roger, and Ali Metwalli. (2006) 2006. Mergers and Acquisitions in Asia. 1st ed. Taylor and Francis. https://www.perlego.com/book/714741/mergers-and-acquisitions-in-asia-pdf.
Harvard Citation
Tang, R. and Metwalli, A. (2006) Mergers and Acquisitions in Asia. 1st edn. Taylor and Francis. Available at: https://www.perlego.com/book/714741/mergers-and-acquisitions-in-asia-pdf (Accessed: 14 October 2022).
MLA 7 Citation
Tang, Roger, and Ali Metwalli. Mergers and Acquisitions in Asia. 1st ed. Taylor and Francis, 2006. Web. 14 Oct. 2022.