Practical Network Automation
eBook - ePub

Practical Network Automation

A beginner's guide to automating and optimizing networks using Python, Ansible, and more, 2nd Edition

Abhishek Ratan

  1. 226 pages
  2. English
  3. ePUB (adapté aux mobiles)
  4. Disponible sur iOS et Android
eBook - ePub

Practical Network Automation

A beginner's guide to automating and optimizing networks using Python, Ansible, and more, 2nd Edition

Abhishek Ratan

DĂ©tails du livre
Aperçu du livre
Table des matiĂšres
Citations

À propos de ce livre

Leverage the power of Python, Ansible and other network automation tools to make your network robust and more secure

Key Features

  • Get introduced to the concept of network automation with relevant use cases
  • Apply Continuous Integration and DevOps to improve your network performance
  • Implement effective automation using tools such as Python, Ansible, and more

Book Description

Network automation is the use of IT controls to supervise and carry out everyday network management functions. It plays a key role in network virtualization technologies and network functions.

The book starts by providing an introduction to network automation, and its applications, which include integrating DevOps tools to automate the network efficiently. It then guides you through different network automation tasks and covers various data digging and performing tasks such as ensuring golden state configurations using templates, interface parsing. This book also focuses on Intelligent Operations using Artificial Intelligence and troubleshooting using chatbots and voice commands. The book then moves on to the use of Python and the management of SSH keys for machine-to-machine (M2M) communication, all followed by practical use cases. The book also covers the importance of Ansible for network automation, including best practices in automation; ways to test automated networks using tools such as Puppet, SaltStack, and Chef; and other important techniques.

Through practical use-cases and examples, this book will acquaint you with the various aspects of network automation. It will give you the solid foundation you need to automate your own network without any hassle.

What you will learn

  • Get started with the fundamental concepts of network automation
  • Perform intelligent data mining and remediation based on triggers
  • Understand how AIOps works in operations
  • Trigger automation through data factors
  • Improve your data center's robustness and security through data digging
  • Get access infrastructure through API Framework for chatbot and voice interactive troubleshootings
  • Set up communication with SSH-based devices using Netmiko

Who this book is for

If you are a network engineer or a DevOps professional looking for an extensive guide to help you automate and manage your network efficiently, then this book is for you. No prior experience with network automation is required to get started, however you will need some exposure to Python programming to get the most out of this book.

Foire aux questions

Comment puis-je résilier mon abonnement ?
Il vous suffit de vous rendre dans la section compte dans paramĂštres et de cliquer sur « RĂ©silier l’abonnement ». C’est aussi simple que cela ! Une fois que vous aurez rĂ©siliĂ© votre abonnement, il restera actif pour le reste de la pĂ©riode pour laquelle vous avez payĂ©. DĂ©couvrez-en plus ici.
Puis-je / comment puis-je télécharger des livres ?
Pour le moment, tous nos livres en format ePub adaptĂ©s aux mobiles peuvent ĂȘtre tĂ©lĂ©chargĂ©s via l’application. La plupart de nos PDF sont Ă©galement disponibles en tĂ©lĂ©chargement et les autres seront tĂ©lĂ©chargeables trĂšs prochainement. DĂ©couvrez-en plus ici.
Quelle est la différence entre les formules tarifaires ?
Les deux abonnements vous donnent un accĂšs complet Ă  la bibliothĂšque et Ă  toutes les fonctionnalitĂ©s de Perlego. Les seules diffĂ©rences sont les tarifs ainsi que la pĂ©riode d’abonnement : avec l’abonnement annuel, vous Ă©conomiserez environ 30 % par rapport Ă  12 mois d’abonnement mensuel.
Qu’est-ce que Perlego ?
Nous sommes un service d’abonnement Ă  des ouvrages universitaires en ligne, oĂč vous pouvez accĂ©der Ă  toute une bibliothĂšque pour un prix infĂ©rieur Ă  celui d’un seul livre par mois. Avec plus d’un million de livres sur plus de 1 000 sujets, nous avons ce qu’il vous faut ! DĂ©couvrez-en plus ici.
Prenez-vous en charge la synthÚse vocale ?
Recherchez le symbole Écouter sur votre prochain livre pour voir si vous pouvez l’écouter. L’outil Écouter lit le texte Ă  haute voix pour vous, en surlignant le passage qui est en cours de lecture. Vous pouvez le mettre sur pause, l’accĂ©lĂ©rer ou le ralentir. DĂ©couvrez-en plus ici.
Est-ce que Practical Network Automation est un PDF/ePUB en ligne ?
Oui, vous pouvez accĂ©der Ă  Practical Network Automation par Abhishek Ratan en format PDF et/ou ePUB ainsi qu’à d’autres livres populaires dans Computer Science et Computer Networking. Nous disposons de plus d’un million d’ouvrages Ă  dĂ©couvrir dans notre catalogue.

Informations

Année
2018
ISBN
9781789950403
Édition
2

Continual Integration

Now that you're comfortable interacting with devices through Python and understand the basics of Artificial Intelligence and Robotic Process Automation (RPA), let's look at some working, detailed use cases to help us to understand these concepts in detail. We'll leverage the API framework that was deployed in Chapter 5, Web Framework for Automation Triggers, to create solutions that can perform network operations in scalable environments. Additionally, we'll look at some use cases on how to leverage next-generation technologies, such as chatbot and voice simulations, to assist in network operations.
The following topics will be covered in this chapter:
  • Remediation using intelligent triggers
  • Standardizing configurations on scale
  • Chatbot interactions
  • Additional use cases

Technical requirements

Here are the technical requirements for this chapter:
  • Python
  • Slack account (for chatbot collaboration)
  • Splunk
  • API and JavaScript basics
  • GitHub URL at https://github.com/PacktPublishing/Practical-Network-Automation-Second-Edition

Remediation using intelligent triggers

In a scalable or high-availability environment, an engineer needs to ensure there is a near zero possibility of human error. For a service based organization, even a small downtime can cost millions of dollars in revenue or even deterioration of a brand's image. There are high chances of outages while performing certain tasks, either due to manual executions or to certain hardware failures.
A solution to this typical real-life problem is to quickly identify the problem and perform self-remediation. Let's convert this problem into a particular use case.
In this use case, we need to ensure that all of the routers in our environment always have the Loopback45 interface up and running. This could be a critical interface, where accidentally shutting off this interface might stop traffic flow to a router or a router may stop responding to sending Syslogs or traps to a particular destination. This can also adversely affect the routing in the environment if this interface is tightly coupled with the routing traffic patterns in the organization.
We would be using Python to collect the stats of each of the interfaces on each router and send it to a data collector and analysis tool (Splunk). For a recurring check on the available data, we would use intelligent queries and auto-trigger remediation if we see any Loopback45 interface being down due to any reason. The auto-remediation will enable the interface to ensure we have near-zero downtime.
As a prerequisite, we need to perform the following steps.

Step 1 – ensuring Splunk is configured to receive the data

In this step, we configure Splunk to monitor a specific folder in the local machine for any new data. Data would typically be in a comma-separated format generated from a Python script written in this particular folder.
Listed are the steps to configure Splunk for monitoring the folder:
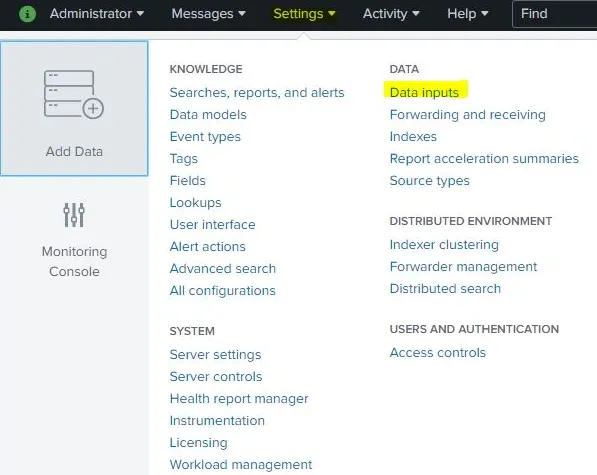
  1. Select Data inputs from the Settings drop-down menu:
  1. Configure data input to monitor a particular folder (C:\splunklogs in our example):
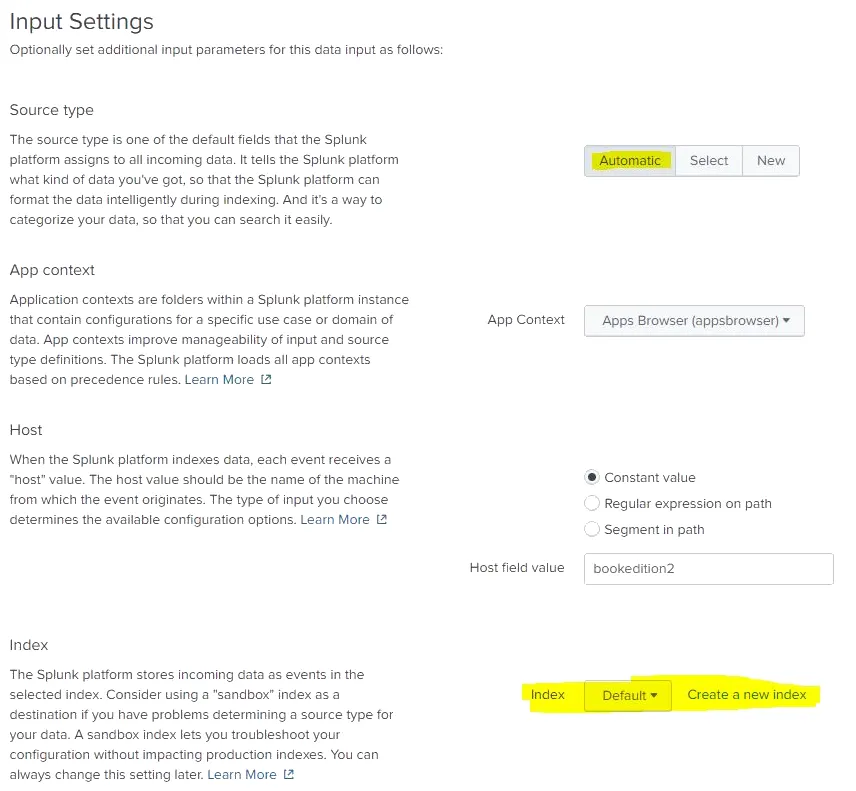
  1. Ensure the data selection type is Automatic (Splunk has the built-in intelligence to parse the data in a database format based upon certain specific types of input, which is a command-separated file in our case). Also, the index or the main header can be modified for this new data in Splunk:

Step 2 – validating the data (sample data)

Once we are done with the configuration, we can provide some sample data in a text file to determine whether the data is available in Splunk; this can be any data in a comma-separated format but residing in the folder that is being monitored:
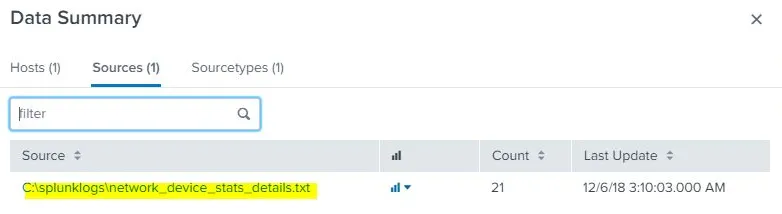
  • On the main search page, we see Data Summary showing some events. A click on it will show the details, and sources will show that from which file, how many records (or events in Splunk) are being learned:
  • Here is a sample set of data in Splunk's auto-discovered format (a query will be performed on this data in Splunk using Search Processing Language (SPL) that is specific to Splunk, to identify potential problems):

Step 3 – writing script

This is where we write a script to ensure we capture the specific status of every interface on a given set of routers and write it back to a file. This would also be ingested by Splunk.
In our case, we would fetch the stats from all of the routers (192.168.20.1-192.168.20.4) every five minutes and update the file in C:\splunklogs. In other words, Splunk would have the refreshed the data that we can use for validation every five minutes. Another benefit of this approach is for historic data collection. Using this approach, we can always determine the Root Cause Analysis (RCA) or even identify any flaps or an interface utilization over a period of time, we can leverage Splunk for data analysis.
Let's split the code into sections to understand each part:
  1. Initialize the environment by importing libraries required for the execution of the script:
# concurrent threads executed at a time - 25
# each thread connect to the router . fetch show interfaces output
# invoke fetch_interface_summary and get the interface names in a list format
# network device ips are input in allips variable
# this takes around 30 secs to execute
# data is written on c:\splunklogs\network_device_stats_details.txt

import re
import netmiko
import time
import datetime
import math
from threading import Thread
import logging
import threading
from random import randrange
import itertools
import itertools
import sys
import base64
  1. Parse the given raw configuration, split the configuration into separate groupings (for example, a s...

Table des matiĂšres