Seismic Data Interpretation using Digital Image Processing
Abdullatif A. Al-Shuhail, Saleh A. Al-Dossary, Wail A. Mousa
This is a test
This is a test
English
ePUB (adapté aux mobiles)
Disponible sur iOS et Android
eBook - ePub
Seismic Data Interpretation using Digital Image Processing
Abdullatif A. Al-Shuhail, Saleh A. Al-Dossary, Wail A. Mousa
Détails du livre
Aperçu du livre
Table des matières
Citations
À propos de ce livre
Bridging the gap between modern image processing practices by the scientific community at large and the world of geology and reflection seismology
This book covers the basics of seismic exploration, with a focus on image processing techniques as applied to seismic data. Discussions of theories, concepts, and algorithms are followed by synthetic and real data examples to provide the reader with a practical understanding of the image processing technique and to enable the reader to apply these techniques to seismic data. The book will also help readers interested in devising new algorithms, software and hardware for interpreting seismic data.
Key Features:
Provides an easy to understand overview of popular seismic processing and interpretation techniques from the point of view of a digital signal processor.
Presents image processing concepts that may be readily applied directly to seismic data.
Includes ready-to-run MATLAB algorithms for most of the techniques presented.
The book includes essential research and teaching material for digital signal and image processing individuals interested in learning seismic data interpretation from the point of view of digital signal processing. It is an ideal resource for students, professors and working professionals who are interested in learning about the application of digital signal processing theory and algorithms to seismic data.
Foire aux questions
Comment puis-je résilier mon abonnement ?
Il vous suffit de vous rendre dans la section compte dans paramètres et de cliquer sur « Résilier l’abonnement ». C’est aussi simple que cela ! Une fois que vous aurez résilié votre abonnement, il restera actif pour le reste de la période pour laquelle vous avez payé. Découvrez-en plus ici.
Puis-je / comment puis-je télécharger des livres ?
Pour le moment, tous nos livres en format ePub adaptés aux mobiles peuvent être téléchargés via l’application. La plupart de nos PDF sont également disponibles en téléchargement et les autres seront téléchargeables très prochainement. Découvrez-en plus ici.
Quelle est la différence entre les formules tarifaires ?
Les deux abonnements vous donnent un accès complet à la bibliothèque et à toutes les fonctionnalités de Perlego. Les seules différences sont les tarifs ainsi que la période d’abonnement : avec l’abonnement annuel, vous économiserez environ 30 % par rapport à 12 mois d’abonnement mensuel.
Qu’est-ce que Perlego ?
Nous sommes un service d’abonnement à des ouvrages universitaires en ligne, où vous pouvez accéder à toute une bibliothèque pour un prix inférieur à celui d’un seul livre par mois. Avec plus d’un million de livres sur plus de 1 000 sujets, nous avons ce qu’il vous faut ! Découvrez-en plus ici.
Prenez-vous en charge la synthèse vocale ?
Recherchez le symbole Écouter sur votre prochain livre pour voir si vous pouvez l’écouter. L’outil Écouter lit le texte à haute voix pour vous, en surlignant le passage qui est en cours de lecture. Vous pouvez le mettre sur pause, l’accélérer ou le ralentir. Découvrez-en plus ici.
Est-ce que Seismic Data Interpretation using Digital Image Processing est un PDF/ePUB en ligne ?
Oui, vous pouvez accéder à Seismic Data Interpretation using Digital Image Processing par Abdullatif A. Al-Shuhail, Saleh A. Al-Dossary, Wail A. Mousa en format PDF et/ou ePUB ainsi qu’à d’autres livres populaires dans Technik & Maschinenbau et Signale & Signalverarbeitung. Nous disposons de plus d’un million d’ouvrages à découvrir dans notre catalogue.
The exploration seismic method is the most widely used and well-known geophysical technique among many exploration geophysical surveying methods. Such data can be processed to reveal details of geologic structures on scales from the top tens of meters of the Earth's crust to its inner core [1, 2]. Part of its success lies in the fact that raw seismic data can be processed to produce seismic sections (images) of the subsurface structure. A geologist and/or a geophysicist can then make an informed interpretation by understanding how such images were created [1, 3]. In the past few decades, advances in signal- and image-processing algorithms have greatly contributed to the geologic interpretation of exploration seismic data sets. Large areas of petroleum-bearing sedimentary basins are currently imaged via advanced three-dimensional (3D) seismic processing techniques. Such advances and research contributions from the image-processing community have enabled seismic interpreters to better assess possible oil/gas reservoirs.
1.2 Exploration Seismic Data: From Acquisition to Interpretation
The exploration seismic method involves three main stages: seismic data acquisition, seismic data processing, and seismic data interpretation. The main aim of the exploration seismic method is knowledge of the distribution of wave impedance that reflects the subsurface geology. Exploration seismic waves typically penetrate the subsurface up to a few kilometers in depth. Basically, one records (a) the amplitudes of the reflected seismic waves and (b) the time at which such amplitudes arrived at the receiver. Then the data can be processed and interpreted using signal- and image-processing algorithms, which ultimately influence the decision on where to drill wells that will eventually produce hydrocarbons.
1.2.1 Seismic Data Acquisition
The first stage in exploration seismic surveys is the acquisition stage, where the seismic data are collected by an array of receivers (geophones for land and hydrophones for marine), transmitted over a narrow-band channel, and stored for processing. The acquisition can be done to acquire two-dimensional (2D) or 3D seismic data. Both 2D and 3D acquisition receivers can be single component (recording compressional vertical ground motion) or multicomponent (recording additional horizontal ground motions). The acquisition is commonly based on the so-called common midpoint (CMP) technique, a recording–processing method where each subsurface point is covered using many source-receiver pairs. After performing some data correction, the data are combined in a way which provides a CMP section that approximates the traces that would be recorded by a coincident source and receiver at each location, but with improved signal-to-noise ratio (SNR). The objective is to attenuate random effects and events whose dependence on offset is different from that of primary reflections. Other acquisition methods include narrow azimuth. More advanced acquisition techniques such as multi-azimuth, wide-azimuth, and rich-azimuth are recent innovations that aim to address the illumination problems inherent in the traditional narrow azimuth seismic technique. These types of advanced reflection seismic acquisition methods improve the SNR and illumination in complex geology.
1.2.2 Seismic Data Processing
Next comes the processing of the acquired seismic data sets. Seismic data processing involves the use of many sequential mathematical and signal processing techniques, which are blended with a somewhat subjective interpretation by an experienced geophysicist. This includes seismic data processing steps like geometric spreading correction, frequency filtering, deconvolution, velocity analysis, static correction, seismic migration and imaging, and so on [1]. Finally, the processed data go to the interpretation stage, which mainly aims to derive a simple, plausible geologic model that is compatible with the observed data. It can utilize subjective and objective ways to interpret exploration seismic images.
1.2.3 Seismic Data Interpretation
Seismic data interpretation aims to extract all available geologic information from the processed and imaged seismic data, such as structure, stratigraphy, and rock properties. Interpretation involves sophisticated image processing algorithms, thanks to advances in computers and image processing techniques. The interpretation is done based on the reservoir types: structural or stratigraphic. Considering the rock structures, it is very important to understand the regional tectonic settings and similar ones existing around the world. Additionally, the interpreter has to know the style of the structure – such as a fault, a salt dome, an anticline, and so on – and identify the complexity of the structures in the imaged seismic data. When considering the rocks' stratigraphy, the interpreter has to understand the age relationships and depositional environment of important geologic formations of oil/gas exploration interest. Also, one must know the time, space, and production relationship between the structure and stratigraphy in the area of interest. Finally, the interpretation process should consider the rock properties and lithology by knowing the rock types (e.g., sandstone, carbonate) and the existence of salt, anhydrite, limestone or dolomite in the shallow section of the data, where they can distort the seismic signals. One must also know the weathering layer lithology and how variable it is with respect to the survey area.
1.3 The Seismic Convolution Model
The convolutional model of seismic data is essential to understand how a seismic trace is formed. The trace represents a combined response of layered ground and a recording system to a seismic source wavelet. Any display of a collection of one or more seismic traces is termed a seismogram. Assuming that the wavelet shape and amplitude do not change as the wavelet propagates through such layered ground, the resultant seismic trace may be regarded as the convolution of the input wavelet with a time series known as a reflectivity function, which is composed of unit sample functions. Each unit sample function has an amplitude related to the reflection coefficient at a layer boundary and a traveltime equivalent to the two-way reflection time from the surface to that boundary.1 Furthermore, the reflectivity function represents the impulse response of the layered ground, which is basically the output for a unit sample input. Since the source wavelet has a finite length, individual reflections from closely spaced boundaries may overlap in time on the resultant seismogram (seismic section). Figure 1.1 represents a typical seismic convolution model.
Figure 1.1 During the acquisition stage, a seismic wavelet is convolved with the reflectivity function of the rocks and recorded via many receivers to obtain a seismogram. The seismogram is processed to yield a seismic image. This image is then analyzed by interpreters. Note that the reflectivity function is related to the geologic section of the subsurface through the reflection coefficient of each geologic boundary and the two-way traveltime.
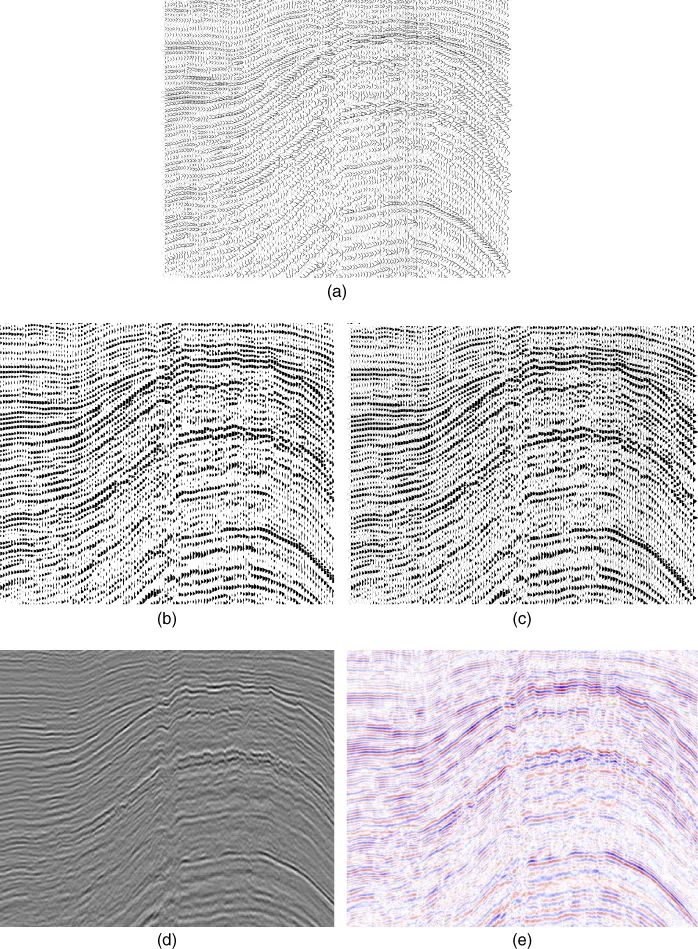
Once the data are processed and a seismic image is obtained, several ways exist of displaying seismic images. One of the most commonly used displays is, for example, the wiggle display, as seen in Figure 1.2a. It vertically plots seismic trace amplitudes as functions of time (with time increasing downward), where the positive peaks are to the right of every trace and the negative ones are to the left of every trace. Another common method of displaying a seismic images is the so-called variable-area display, which shades the area under the wiggle trace to make coherent seismic events (see Figure 1.2b), rendering the positive peaks evident.2 The combination of variable area and wiggle is known as wiggle–variable-area display (Figure 1.2c). Additionally, the variable-density display represents amplitude values by the intensity of shades of gray (black is for the maximum amplitude value and white is for the minimum amplitude value) and in colors (e.g., blue is for the maximum amplitude value, white is for the zero amplitude value, and red is for the minimum amplitude value) like the ones shown in Figure 1.2d and e, respectively. These can be used in different ways with different seismic attributes and color maps, as will be discussed later in the book.
Figure 1.2 Various displays for a seismic section image: (a) wiggle display, (b) variable area display, (c) wiggle-variable area display, (d) gray-scaled variable density display, and (e) colored variable density display. Note that the vertical axis represents the two-way traveltime increasing downward, while the horizontal axis represents the distance from left to right. (See color plate section for the color representation of this figure.)
1.4 Summary
This chapter introduced the exploration seismic method. It also described the basic convolution model by which seismic data are acquired and recorded. There are various ...