Be prepared for exam day with Barron's. Trusted content from AP experts! Barron's AP Q&A Statistics features 600 questions with answer explanations designed to sharpen your critical thinking skills, provide practice for all AP question types, and maximize understanding of the concepts covered on the AP exam. Why Study with AP Q&A?
Each practice question follows the AP Statistics curriculum and includes Exploratory Analysis, Collecting and Producing Data, Probability, and Statistical Inference
All content is specifically created to provide practice for frequently tested topics on the AP Statistics exam
Answers include comprehensive explanations-- you won't just learn why an answer is correct, you'll learn why the other choices are incorrect
Check out Barron's AP Statistics Premium for even more review, full-length practice tests, and access to Barron's Online Learning Hub for a timed test option and automated scoring.
Domande frequenti
Come faccio ad annullare l'abbonamento?
È semplicissimo: basta accedere alla sezione Account nelle Impostazioni e cliccare su "Annulla abbonamento". Dopo la cancellazione, l'abbonamento rimarrà attivo per il periodo rimanente già pagato. Per maggiori informazioni, clicca qui
È possibile scaricare libri? Se sì, come?
Al momento è possibile scaricare tramite l'app tutti i nostri libri ePub mobile-friendly. Anche la maggior parte dei nostri PDF è scaricabile e stiamo lavorando per rendere disponibile quanto prima il download di tutti gli altri file. Per maggiori informazioni, clicca qui
Che differenza c'è tra i piani?
Entrambi i piani ti danno accesso illimitato alla libreria e a tutte le funzionalità di Perlego. Le uniche differenze sono il prezzo e il periodo di abbonamento: con il piano annuale risparmierai circa il 30% rispetto a 12 rate con quello mensile.
Cos'è Perlego?
Perlego è un servizio di abbonamento a testi accademici, che ti permette di accedere a un'intera libreria online a un prezzo inferiore rispetto a quello che pagheresti per acquistare un singolo libro al mese. Con oltre 1 milione di testi suddivisi in più di 1.000 categorie, troverai sicuramente ciò che fa per te! Per maggiori informazioni, clicca qui.
Perlego supporta la sintesi vocale?
Cerca l'icona Sintesi vocale nel prossimo libro che leggerai per verificare se è possibile riprodurre l'audio. Questo strumento permette di leggere il testo a voce alta, evidenziandolo man mano che la lettura procede. Puoi aumentare o diminuire la velocità della sintesi vocale, oppure sospendere la riproduzione. Per maggiori informazioni, clicca qui.
AP Q&A Statistics:With 600 Questions and Answers è disponibile online in formato PDF/ePub?
Sì, puoi accedere a AP Q&A Statistics:With 600 Questions and Answers di Martin Sternstein in formato PDF e/o ePub, così come ad altri libri molto apprezzati nelle sezioni relative a Study Aids e Advanced Placement. Scopri oltre 1 milione di libri disponibili nel nostro catalogo.
1.One element in the dotplot above is labeled X. Which of the statements below is true?
(A) X has the smallest z-score, in absolute value, of any element in the set.
(B) X has the largest z-score, in absolute value, of any element in the set.
(C) X has the smallest value of any element in the set.
(D) A boxplot will plot X as an isolated point.
(E) A back-to-back stemplot will show two symmetric clusters.
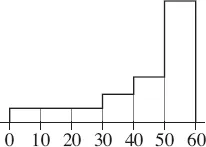
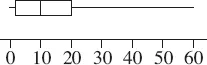
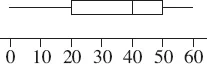
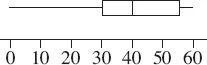
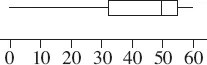
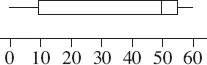
2.The histogram shown above might correspond to which of the boxplots below?
(A)
(B)
(C)
(D)
(E)
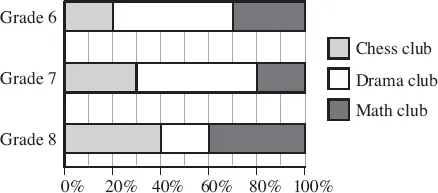
3.All students at a private middle school are required to sign up for one of the three clubs: chess, drama, or math. The graph below shows the distribution of participation by grade level.
Which of the following statements is incorrect?
(A) 30 percent of the 6th graders joined the math club.
(B) The number of 8th graders who joined the chess club is the same as the number of 8th graders who joined the math club.
(C) The number of 6th graders who joined the drama club is the same as the number of 7th graders who joined the drama club.
(D) The percent of 8th graders who joined the math club is twice the percent of 7th graders who joined the math club.
(E) The percent of 6th graders who joined the chess club is the same as the percent of 8th graders who joined the drama club.
4.Which of the following is a true statement about stemplots?
(A) Stemplots are equally useful for small and for very large data sets.
(B) Stemplots are useful both for quantitative and for categorical data sets.
(C) Stemplots can show symmetry, gaps, clusters, and outliers.
(D) Stems should be skipped only if there is no data value for a particular stem.
(E) Whether or not to provide a key depends on the relative importance of the data.
5.Which of the following is incorrect?
(A) In histograms, frequencies can be determined from relative heights.
(B) In histograms, relative areas correspond to relative frequencies.
(C) Boxplots, dotplots, stemplots, and histograms can all show skewness.
(D) Sets with different distribution shapes can have identical boxplots.
(E) Both dotplots and stemplots can show symmetry, gaps, clusters, and outliers.
6.If three stations are selling gas for $2.10 per gallon, six are selling gas for $2.05 per gallon, and ten are selling gas for $2.00 per gallon, what is the median price per gallon among these stations?
(A) $2.00
(B) $2.025
(C) $2.0316
(D) $2.05
(E) $2.075
7.Suppose the average score of a national exam is 1,000 with a standard deviation of 200. If each score is increased by 50 and then each result is increased by 5 percent, what are the new mean and standard deviation?
(A) μ = 1,100 and σ = 200
(B) μ = 1,100 and σ = 210
(C) μ = 1,102.5 and σ = 200
(D) μ = 1,102.5 and σ = 210
(E) μ = 1,102.5 and σ = 212.5
8.For which of the following variables would it be most appropriate to construct a histogram?
(A) Television brand
(B) Insect species
(C) Gender
(D) Eye color
(E) Phone call length
9.If the standard deviation of a set of observations is 0, you can conclude
(A) that a mistake in arithmetic has been made
(B) that there is no relationship among the observations