![]()
SECTION 3
RATE EQUATIONS APPROACH AND
THE FUTURE OF WORLD POPULATION
![]()
CHAPTER 10
USING A RATE EQUATIONS APPROACH TO MODEL WORLD POPULATION TRENDS*
by Julio A. Gonzalo and Felix F. Muñoz
Introduction
The UN data on world population, fertility rates, birth and death rates provide abundant and reliable information to investigate present population trends, and to make guesses about the future. These data can be complemented with vital statistical data from the UN Department of Economic and Social Affairs.1
In what follows we introduce population rate equations (Dekker, 1962; Loudon, 2000; Gonzalo et al., 2002) appropriate to describe the evolution of the population of a two level system in terms of the known birth rate (BR=rb) and death rate (DR = rd), under the assumption that total biomass is approximately conserved. Global biomass would play the role of a universal constant that somehow provides an upper limit to population, at least in the short-medium term. Obviously global biomass can change within certain limits depending on environmental conditions but it is not completely elastic. In this paper we use a rate equations approach (Gonzalo, 2010) to describe world population dynamics which involve a conservative principle. Within a human generation (about 25 years) the world total biomass may be expected to change at most a factor of 2 to 3 –except if a nuclear war, global pestilence or the collision of a comet with our planet take place.
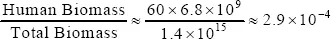
The Earth has a biosphere capable of sustaining life: plants, animals and men. It has been estimated that the total amount of living matter on Earth is about 1.4×10¹⁵Kg according to the World Atlas of Biodiversity (Groombridge and Jenkins, 2002).2 Men, like other higher animals, live on a diet of carbohydrates, fats and proteins. As it is well known, in the last instance, the chain of life in our planet begins with photosynthesis by the green plants. According to FAO (see Vian Ortuño 1994) the distribution of vegetal biomass is roughly the following: 46% forests and lower wild vegetation; 10% pastures and steppes; 1.8% deserts; 6.2% crops; 2.9% biomass in continental waters; 33% biomass in the oceans. At present the ratio of human to total biomass is roughly
The consumption (and large-scale waste) of energy is of course an important factor affecting world population. However, it should be kept in mind that converting directly 1/6000 of the radiant energy coming from the Sun would provide sufficient electrical or chemical energy to satisfy present world energy needs. Fusion energy research may someday contribute effectively to provide abundant, safe and clean energy.
Under the above mentioned assumption, the solutions of rate equations are shown to simulate quantitatively well the actual time evolution of the world population P(t) in the second part of the twentieth century, and to provide reasonable grounds for estimating quantitatively the short term evolution of world population. The main result of this paper is that a linear extrapolation of the actual data up to 2020 suggests a population decrease in the world at about mid-century. This result is consistent –at least partially- with UN, World Bank and IIASA projections for the rest of the century (assuming the medium scenario).3
As far as we know rate equations have not been previously used to determine world population trends. A main advantage of this approach is that it needs very few numerical parameters to simulate population trends in comparison to other alternative approaches.4
The paper is organized as follows: in section 2 we derive the rate equations that we use to describe and predict world population in the 21st Century; section 3 offers a brief analysis of World population data from 1950 to 2010; section 4 presents the results of applying rate equations to describe quantitatively world population trends; and finally, section 5 is the conclusion.
Rate equations
We consider a certain step change (up or down) in population associated with a correlative change (up or down) in human biomass ΔM(Kg) such that the final change in population (after the step is over) is given by
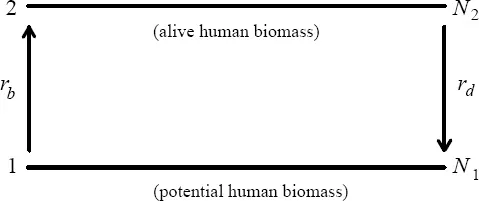
Where N2(t) is the number of individuals (men and women) actually alive at time t, and N1(t) the number of individuals potentially alive at the same time. N1(t) corresponds, therefore, to the amount of biomass potentially convertible into human mass at that time. Time t is in the interval (beginning) ti≤t≤tf (end), where tf is sufficiently larger than the relevant characteristic time τ* for the step (up or down). We can assume ΔN to be in the range 109 < N < 1011, in principle, and NRL (the background replacement level population at t < ti) to be of the same order of magnitude.
During the transition between N(0) = NRL (original replacement level) to N(tf) = NRL + ΔN(tf) (final replacement level) the excess human biomass is distributed between the two levels in such a way that always
At any given time there is a certain birth rate, BR = rb, governing the transition of human biomass from level 1 to level 2, and a certain death rate, likewise governing the transition from level 2 to level 1.
Figure 10.1. The world as two level system to describe step (+/-) over a certain population background (Replacement Level)
We can define the respective transition probabilities (say per 100 or 1000 persons) per unit time as
where r0 ≡ p0e−α0 could be viewed as the product of an attempt frequency p0 (inverse of a natural characteristic time 2τ) modified ...