What is the Law of Supply and Demand?

MA, Management Science (University College London)
Date Published: 26.07.2023,
Last Updated: 19.07.2024
Share this article
Defining the law of supply and demand
The law of supply and demand dictates the market price of a product or service by looking into the dynamics of two major market forces: supply (i.e., seller’s willingness to sell, in units) and demand (i.e., buyer’s willingness to buy, in units).
In a nutshell, the law states that as the price of a product increases, supply will increase with more sellers willing to produce and sell goods in the market. However, demand will eventually decrease because generally speaking, less people will want to buy a product at a higher price than its worth. Since these forces act in opposite directions, the market price settles where and when these forces are in equilibrium. That is, when quantity demanded equals quantity supplied.
James Steuart, Scottish economist of the 18th century, was the first to coin the term “supply and demand”. He did so in his book An Inquiry into the Principles of Political Economy (2019, [1767]). However, economist Adam Smith delved into the dynamics of these two forces and theorised this law in his book The Wealth of Nations (Smith, 2019, [1776]).
When the quantity of any commodity which is brought to market falls short of the effectual demand, all those who are willing to pay [...] cannot be supplied with the quantity which they want [...] Some of them will be willing to give more. A competition will begin among them, and the market price will rise [...] When the quantity brought to market exceeds the effectual demand, it cannot be sold to those who are willing to pay [...] The market price will sink [...]. (2019, [1776])

Adam Smith
When the quantity of any commodity which is brought to market falls short of the effectual demand, all those who are willing to pay [...] cannot be supplied with the quantity which they want [...] Some of them will be willing to give more. A competition will begin among them, and the market price will rise [...] When the quantity brought to market exceeds the effectual demand, it cannot be sold to those who are willing to pay [...] The market price will sink [...]. (2019, [1776])
To better comprehend the workings of this law, it is important to understand how supply and demand work individually.
The law of demand
The English economist Charles Davenant stated the law of demand (in isolation of that of supply) in his paper ‘Probable Methods of Making People Gainers in the Balance of Trade’ (1699). His findings were then borrowed by economists and explained in books including Microeconomic Theory: Basic Principles and Extensions (Nicholson and Snyder, 2016, [1972]) where the law of demand is defined.
Conditional on all else being equal, as the price of a good increases, quantity demanded will decrease; conversely, as the price of a good decreases, quantity demanded will increase. (2016, [1972])
Walter Nicholson & Christopher Snyder
Conditional on all else being equal, as the price of a good increases, quantity demanded will decrease; conversely, as the price of a good decreases, quantity demanded will increase. (2016, [1972])
Intuitively, when the price of a product rises less people want to buy that product. Conversely, a falling price incentivises consumers to purchase it, and in turn its demand increases. That, in simple terms, is the law of demand.
In his book The Principles of Economics (2021, [1890]), the father of economics Alfred Marshall, found that a good way of representing the relationship between price and quantity demanded was by mapping it out as a downward sloping curve on a price-against-quantity graph.
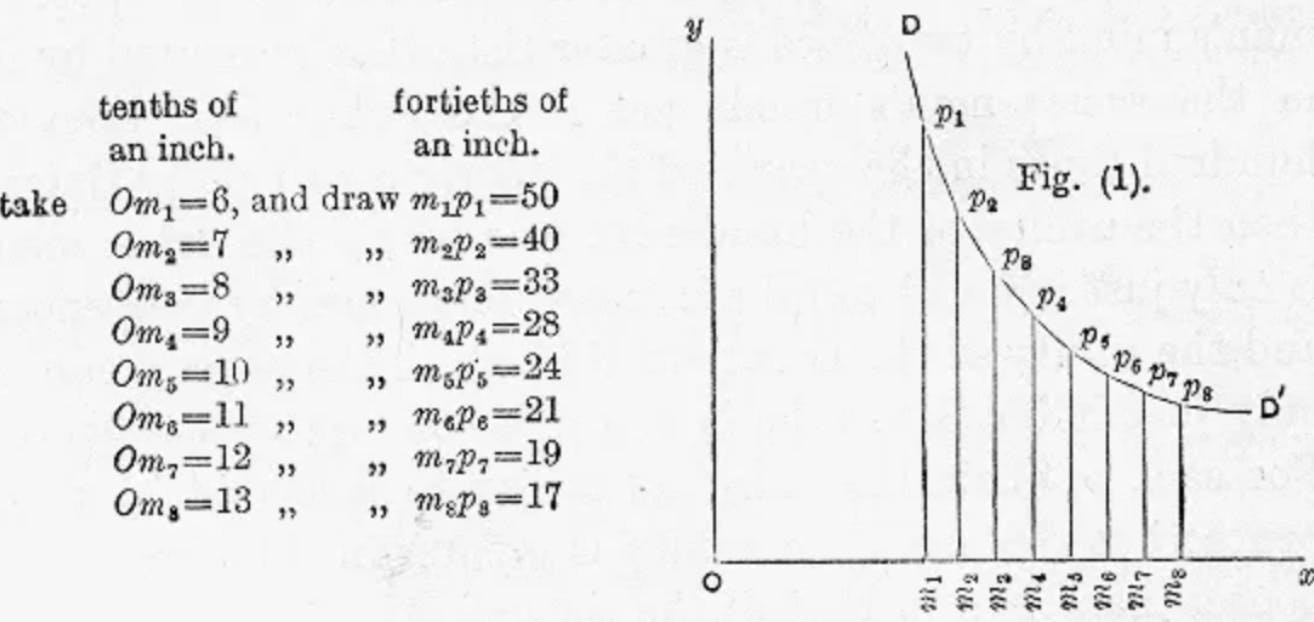
Such a demand schedule may be translated, on a plan now coming into familiar use, into a curve that may be called his demand curve. [...] Then p1, p2.... p8 are points on his demand curve for tea; or as we may say demand points. If we could find demand points in the same manner for every possible quantity of tea, we should get the whole continuous curve DD' as shown in the figure. (2021, [1890])
Alfred Marshall
Such a demand schedule may be translated, on a plan now coming into familiar use, into a curve that may be called his demand curve. [...] Then p1, p2.... p8 are points on his demand curve for tea; or as we may say demand points. If we could find demand points in the same manner for every possible quantity of tea, we should get the whole continuous curve DD' as shown in the figure. (2021, [1890])
Suppose that the below graph (image taken from Principles of Economics) represents the market for tea in the UK. The vertical y-axis depicts the price for tea and the horizontal x-axis the respective quantity demanded. It can be seen that as price falls from p1 to p8, the quantity demanded increases from Om1 to Om8.
These changes in quantity demanded are mainly caused by changes in the price of a product. However, it is important to make a distinction between changes in the quantity demanded and changes in demand. When there is a change in the quantity demanded, there is a movement along the demand curve as shown in Figure 1. However, when there are changes in demand, the demand curve shifts outwards or inwards (Figure 1). These shifts are caused by changes in the income of buyers, consumer trends or preferences, the price of related goods, or future expectations.
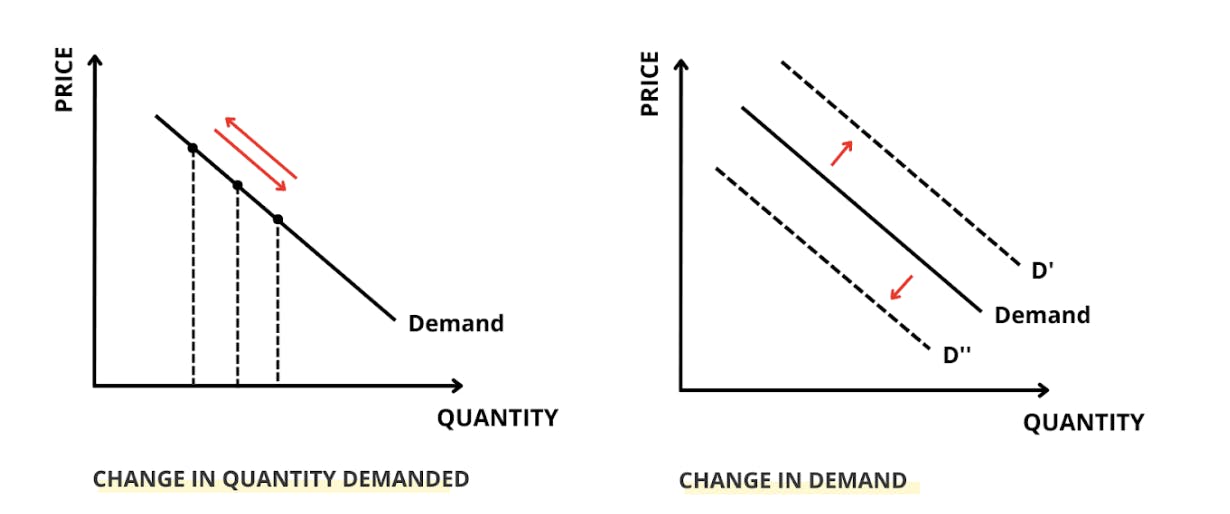
Figure 1 - Graphical Difference between ‘Change in Quantity Demanded and ‘Change in Demand’.
There are some exceptions to the law of demand, since not all goods follow this linear, downward-sloping relationship between price and quantity demanded. In his book The Theory of the Leisure Class (2017, [1899]), economist Thorstein Veblen discovered that for some valuable goods like luxury cars, bags or jewellery, quantity demanded increases as their price increases. In such cases, the demand curve is upward sloping. These are called Veblen goods. Individuals with the purchasing power will demand more of these products as their price increases because it signals increased wealth and “reputability”.
Conspicuous consumption of valuable goods is a means of reputability to the gentleman of leisure. (2017, [1899])
Thorstein Veblen
Conspicuous consumption of valuable goods is a means of reputability to the gentleman of leisure. (2017, [1899])
The law of supply
The law of supply behaves in similar ways to that of demand, but in the opposite direction. Whilst the law of demand is controlled by buyers in a market, the law of supply is operated by the sellers. As described in the textbook Foundations of Microeconomics I (Kreps, 2012), the law of supply essentially answers the following question: how much output will firms in an industry produce at a given price?
Fixing the prices of all other goods [...], we ask how much output will the firms in the industry produce as a function of the price p1 [...]. (2012)
David M. Kreps
Fixing the prices of all other goods [...], we ask how much output will the firms in the industry produce as a function of the price p1 [...]. (2012)
Generally, as the price of a product increases in an industry, supply increases because more sellers are willing to produce and sell their goods in the market to benefit from increased profits. Therefore, higher market prices lead to higher marginal profits for the seller. Following the same logic, if the price of the product decreases in the market, market supply decreases too. In Marshall’s illustrative graphics, this is represented as an upward sloping curve known as the supply curve.
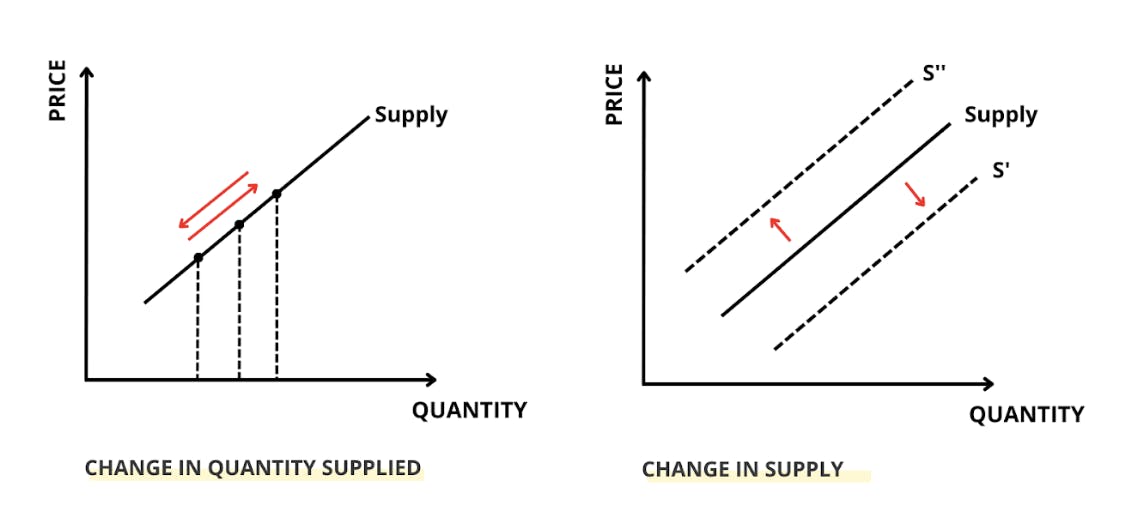
Figure 2 - Graphical Difference between ‘Change in Quantity Supplied and ‘Change in Supply’.
Just like with the law of demand, there is a difference between changes in the quantity supplied (i.e., movements along the supply curve as shown in Figure 2) and changes in supply (shifts in the supply curve). Changes in supply are caused by factors such as the price of raw materials, the amount of labour and capital available to produce or improvements in technological processes that improve the efficiency of production.
The supply and demand curve
As explained earlier, the laws of supply and demand can be brought together to explain how market prices are defined. This can be illustrated by going back to the UK tea market example and bringing together the supply and demand curves into a single diagram. The y-axis represents the price of tea in the UK market, and the x-axis represents the quantity demanded or supplied (Figure 3).
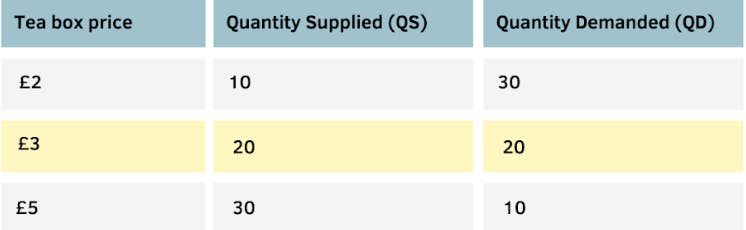
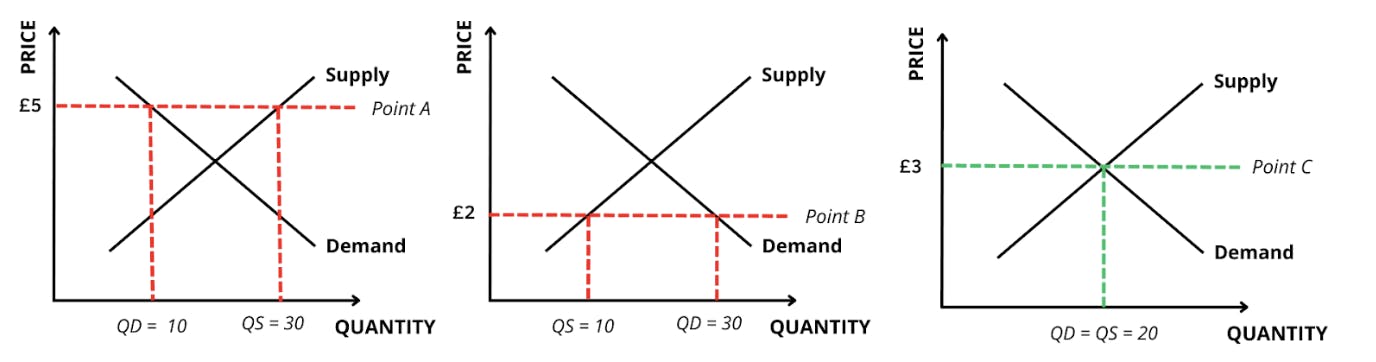
Figure 3 - supply and demand Graphical Example of Tea Market in the UK.
Suppose that tea producers are setting the price of one tea box at £5 (Point A). In simple terms, producers notice that there is a surplus of tea in the market and that not many people are buying tea boxes. Therefore, the price for tea boxes in the market is reduced to £2 (Point B). At this price, loads of people are buying tea but producers are not making enough profits to keep up with demand rates; there is now a shortage of tea in the UK market. Consequently, producers decide to increase the price per box to £3 where enough people are buying tea for them to sustain production and profits. Therefore, according to the law of supply and demand, the equilibrium price (also known as market clearing price) is £3 per tea box. This is the point where all resources in the market are efficiently allocated; there is no excess or lack of tea in the market, and both buyers and sellers are content with their endowments.
Closing thoughts
The law of supply and demand is the foundation to microeconomic theory. It explains the relationship between price changes, quantity supplied and demanded by sellers and buyers in a market. This law is of importance because it ultimately seeks the agreement between both parties to settle a fair equilibrium price such that all resources are efficiently allocated and there are no shortages or surpluses in a market. Recall that economics is the study of the efficient allocation and distribution of scarce resources in an economy. Therefore, arguably, it is in the law of supply and demand where most economic answers can be found.
Further reading on Perlego
To read more about the law of supply and demand applied to industries like the education sector, read Studies of Supply and Demand in Higher Education by Charles T. Clotfelter and Michael Rothschild.
To read more about the life and contributions of Adam Smith, read What Adam Smith Knew by James R. Otteson.
To read more about Alfred Marshall’s life and contributions, read The Economics of Alfred Marshall: Revisiting Marshall's Legacy by Richard Arena and Michael Quere.
To read more about the life and contributions of Thorstein Veblen, read Veblen: The Making of an Economist Who Unmade Economics by Charles Camic.
Supply and demand FAQs
What is the Law of Supply and Demand in simple terms?
What is the Law of Supply and Demand in simple terms?
Does the Law of Supply and Demand apply to all markets in all situations?
Does the Law of Supply and Demand apply to all markets in all situations?
Is the Law of Supply and Demand criticised?
Is the Law of Supply and Demand criticised?
Bibliography
Steuart and James (2019) An Inquiry into the Principles of Political Economy (Vol. 1 of 2). Perlego. Available at: https://www.perlego.com/book/1849797/an-inquiry-into-the-principles-of-political-oeconomy-vol-1-of-2-being-an-essay-on-the-science-of-domestic-policy-in-free-nations-in-which-are-particularly-considered-population-agriculture-trade-industry-money-coin-interest-circulation-banks-exchange-public-credit-and-taxes-pdf
Smith, A. (2019) The Wealth of Nations. Otbebookpublishing. Available at: https://www.perlego.com/book/3556362/the-wealth-of-nations-pdf
Nicholson, W. and Snyder, C. (2016) Microeconomic Theory. [edition unavailable]. Cengage Learning EMEA. Available at: https://www.perlego.com/book/2707119/microeconomic-theory-basic-principles-and-extensions-pdf (Accessed: 12 July 2023).
Marshall, A. (2021) Principles of Economics. Illustrated. Strelbytskyy Multimedia Publishing. Available at: https://www.perlego.com/book/3041868/principles-of-economics-illustrated-pdf
Veblen, T. (2017) The Theory of the Leisure Class. 1st edn. Taylor and Francis. Available at: https://www.perlego.com/book/1578663/the-theory-of-the-leisure-class-pdf
Kreps, D. (2012) Microeconomic Foundations I. Princeton University Press. Available at: https://www.perlego.com/book/735617/microeconomic-foundations-i-choice-and-competitive-markets-pdf
MA, Management Science (University College London)
Inés Luque has a Masters degree in Management Science from University College London. During high school, she developed a strong interest in Economics, leading her to win the national Economics prize in her country of nationality, Spain. Her expertise is in the areas of microeconomics, game theory and design of incentives. Inés is passionate about the publishing industry and is currently working in the consulting department of the Financial Times in London.