Statistics for Compensation
eBook - ePub

Statistics for Compensation

A Practical Guide to Compensation Analysis

John H. Davis

Share book
  1. English
  2. ePUB (mobile friendly)
  3. Available on iOS & Android
eBook - ePub

Statistics for Compensation

A Practical Guide to Compensation Analysis

John H. Davis

Book details
Book preview
Table of contents
Citations

About This Book

An insightful, hands-on focus on the statistical methods used by compensation and human resources professionals in their everyday work

Across various industries, compensation professionals work to organize and analyze aspects of employment that deal with elements of pay, such as deciding base salary, bonus, and commission provided by an employer to its employees for work performed. Acknowledging the numerous quantitative analyses of data that are a part of this everyday work, Statistics for Compensation provides a comprehensive guide to the key statistical tools and techniques needed to perform those analyses and to help organizations make fully informed compensation decisions.

This self-contained book is the first of its kind to explore the use of various quantitative methods—from basic notions about percents to multiple linear regression—that are used in the management, design, and implementation of powerful compensation strategies. Drawing upon his extensive experience as a consultant, practitioner, and teacher of both statistics and compensation, the author focuses on the usefulness of the techniques and their immediate application to everyday compensation work, thoroughly explaining major areas such as:

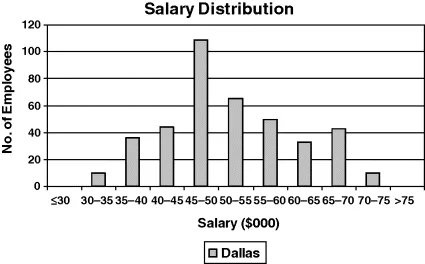
  • Frequency distributions and histograms

  • Measures of location and variability

  • Model building

  • Linear models

  • Exponential curve models

  • Maturity curve models

  • Power models

  • Market models and salary survey analysis

  • Linear and exponential integrated market models

  • Job pricing market models

Throughout the book, rigorous definitions and step-by-step procedures clearly explain and demonstrate how to apply the presented statistical techniques. Each chapter concludes with a set of exercises, and various case studies showcase the topic's real-world relevance. The book also features an extensive glossary of key statistical terms and an appendix with technical details. Data for the examples and practice problems are available in the book and on a related FTP site.

Statistics for Compensation is an excellent reference for compensation professionals, human resources professionals, and other practitioners responsible for any aspect of base pay, incentive pay, sales compensation, and executive compensation in their organizations. It can also serve as a supplement for compensation courses at the upper-undergraduate and graduate levels.

Frequently asked questions

How do I cancel my subscription?
Simply head over to the account section in settings and click on “Cancel Subscription” - it’s as simple as that. After you cancel, your membership will stay active for the remainder of the time you’ve paid for. Learn more here.
Can/how do I download books?
At the moment all of our mobile-responsive ePub books are available to download via the app. Most of our PDFs are also available to download and we're working on making the final remaining ones downloadable now. Learn more here.
What is the difference between the pricing plans?
Both plans give you full access to the library and all of Perlego’s features. The only differences are the price and subscription period: With the annual plan you’ll save around 30% compared to 12 months on the monthly plan.
What is Perlego?
We are an online textbook subscription service, where you can get access to an entire online library for less than the price of a single book per month. With over 1 million books across 1000+ topics, we’ve got you covered! Learn more here.
Do you support text-to-speech?
Look out for the read-aloud symbol on your next book to see if you can listen to it. The read-aloud tool reads text aloud for you, highlighting the text as it is being read. You can pause it, speed it up and slow it down. Learn more here.
Is Statistics for Compensation an online PDF/ePUB?
Yes, you can access Statistics for Compensation by John H. Davis in PDF and/or ePUB format, as well as other popular books in Mathematics & Probability & Statistics. We have over one million books available in our catalogue for you to explore.

Information

Publisher
Wiley
Year
2011
ISBN
9781118002063
Edition
1
Chapter 1
Introduction
The purpose of this book is to provide statistical tools and guides to compensation professionals and human resources professionals responsible for compensation to enable them to conduct sound statistical analyses, focusing on the descriptive statistics that are most used and needed in compensation. This in turn will help their organizations make sound decisions to better attract, retain, motivate, and align the kinds and numbers of people the organizations need.
Compensation is the branch of human resources dealing with the elements of pay provided by an employer to its employees for work performed. Elements of pay include base pay, variable pay, and stock. Human resources is the function of an organization dealing with the management of people employed by the organization.
In a broad sense, compensation helps decide how much jobs are worth and how to pay employees fairly for the work they do. Compensation professionals get involved with analyzing both internal and external pay and organizational data, developing salary structures (the range of pay for jobs), recommending salary increase budgets, creating guidelines for individual salary increases, designing incentive programs, and developing performance management systems. They do all this in the context of an organization's mission, operational and financial considerations, and compensation philosophy, the latter of which they may have helped developed, and integrate all the compensation programs with the other branches of human resources.
The thrust of most professional jobs involves a great deal of decision making. Indeed, on a fundamental basis, making decisions is the job of a compensation (and human resources) professional—decisions that will help the organization achieve its goals and the employees achieve their job-related goals. In the analytical realm, decisions are made in deciding what questions to ask, what related issues are important contextually, what data to use, how to analyze the data, what to recommend, how to present it, and how to act upon the recommendations.
Many times we need to decide and act in the face of uncertainty, as facts are always limited. Furthermore, we often work under great time pressure. All this occurs in the context that the answer to most questions is, “It depends.”
Most of the time we have to make a business case for a recommendation, and the executives to whom we are making a presentation tell us, “Prove it to us using data.” Behind the scenes we have to perform a number of critical thinking steps.1
  • Identify the question behind the question, and identify implications and impacts on business plans, budgets, employee engagement, legal/regulatory restrictions, and so on.
  • Translate the question into analyses and quickly assess how the analyses are best conducted and presented.
  • Get the right data from internal and external data sources, and ensure they are accurate and appropriate.
  • Organize and conduct the analyses and draw conclusions, which is usually an iterative process. The initial analyses may raise more questions than provide answers.
  • Identify the underlying assumptions (i.e., what the answer “depends” on) and implications of the conclusions.
  • Prepare executive-ready analyses and conclusions.
Although this book is directed mainly toward compensation, we will sometimes illustrate techniques with other human resources issues, as compensation professionals, with their statistical and analytical skills, often get involved in broader human resources projects.
1.1 Why do Statistical Analysis?
A compensation professional encounters many issues, such as
  • What is our market position?
  • What should our salary increase budget be this year?
  • What should the new accounting supervisor be paid?
  • What should our strategy be in balancing pay and benefits?
  • Do we have any pay inequities?
and might be involved in helping analyzing other human resources issues, such as
  • How do we decide who gets released when we have a reduction in force?
  • Can we justify the training program?
  • How effective are our employee communications programs?
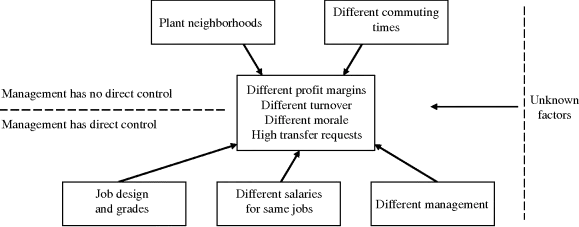
  • Should our policies for time off for two plants be the same?
  • How do the benefits costs of our company compare with those of our competitors?
  • What is the company day care usage?
These examples illustrate three types of issues addressed.
  • Specific issues, such as what should the new accounting supervisor be paid.
  • Policy issues, such as what should be our pay policy with respect to competition.
  • Broad strategy issues, such as how should we balance pay and benefits to attract, retain, and motivate the kinds and numbers of employees we need to achieve the company goals.
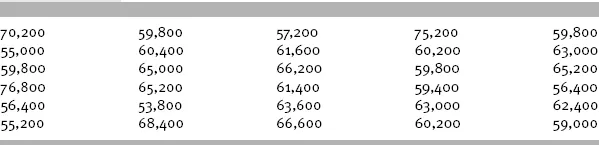
In addressing these issues, we use numbers as one of our starting points—all kinds of numbers that represent all kinds of things such as number of employees, average salary, benefits premiums, performance level, time to vesting, turnover rate, percent using day care facilities, training utilization, productivity, and so on.
But numbers alone will not help us. We have to do something with them to help lead to sound decisions.
Example Analysis
Throughout this book, we will be using a fictitious manufacturing company, BPD, to illustrate the various techniques.
Suppose you are the compensation manager of BPD and the vice president of finance asks you to conduct a quick competitive analysis on accounting supervisors to help determine if a subordinate supervisor is paid competitively. The supervisor in question is paid $68,580.
You gather the data in Table 1.1 on what accounting supervisors are paid in the market.
Table 1.1 Raw Data Market Pay Accounting Supervisor.
img
Can you make sense out of these raw data? Would you present these as the final result of your analysis? Hopefully, the answer to both questions is “no.” Data in its raw form are often of little use.
So you decide to organize, analyze, and describe the data, and provide a tabular and graphical summary as shown in Table 1.2 and Figure 1.1.
Table 1.2 Summary Market Pay Accounting Supervisor.
No. of Incumbents 30
Average 62,207
Low 53,800
P10 56,280
P25 59,500
P50 60,900
P75 65,150
P90 68,580
High 76,800
Standard Deviation 5,465
CV 8.8%
P90/P10 1.22
Figure 1.1 Market pay accounting supervisor
img
The table lists various statistics that are a summary of the raw data. In Chapters 3, 4 and 5, we will define and calculate all the terms (and many more), and discuss how to interpret them, as well as how to construct the graph. The graph is a picture of the distribution of the data. On the horizontal axis are salary categories in $2,000 buckets. The vertical axis is a scale indicating how many data points are in each category. For example, there are six salaries that are between $58,000 and $60,000.
Shown on the chart is the location of what the BPD accounting supervisor is paid. Her salary is $68,580, which is at the 90th percentile, meaning that 90% of the market salaries are below or equal to her salary. She is very well paid with respect to the market.
Now the vice president has the information needed to make a sound decision. The subordinate supervisor is paid at the 90th percentile. The vice president's decision is to leave the pay as is.
The decision model in Figure 1.2 describes the process we just completed.
Figure 1.2 Decision model
img
We started with the statement of the problem, namely to determine if the accounting supe...

Table of contents