![]()
Chapter 1
Desperately Seeking Alpha
Thus, if the earth were viewed from the planets, it would doubtless shine with the light of its own clouds, and its solid body would be almost hidden beneath the clouds. Thus, the belts of Jupiter are formed in the clouds of that planet, since they change their situation relative to one another, and the solid body of Jupiter is seen with greater difficulty through those clouds. And the bodies of comets must be much more hidden beneath their atmospheres, which are both deeper and thicker.
—Isaac Newton, The Principia1
Before there was a Hubble Space Telescope, humans looked at the heavens with the naked eye. In awe they stood, transfixed for a moment wondering where it all came from. On the shoulders of giants like Newton, God installed a mind able to breach the walls of their confines to offer a glimmer of how things worked. Alpha is both a symbol and a term used to describe a variety of tangible things or concepts, but it always refers to the first or most significant occurrence of something. Although the alpha that everyone was seeking in Newton’s day was an understanding of the universe, the history of alpha seekers in the literal sense goes back millennia.
For instance, the Bible documents the Israelites’ investing in land; certainly the early years of their inhabiting Palestine were all about building orchards and vineyards and turning the land from desert and fallow to productive tilling. And of course as evil as it was, slave-traders made investments in ships and the necessary accoutrements for transporting human capital across the ocean. Though these examples are not purely alpha as we think of it today, it was indeed about making an investment, with an expected return as its end point.
Shift to the Netherlands of the 1630s, when an economic bubble formed around the price of newly introduced tulip bulbs. The price of tulip bulbs escalated to dizzying heights before it collapsed, causing great shock to the economy. Alas, tulipmania demonstrates the human tendency to make an investment, with the idea of garnering a return.2 I believe it’s within the definition of being human that one wants to be able to trade labor, capital, or currency for a greater return. The only difference between any business activity and that of an investor purchasing a bundle of securities, representing pieces of a business, is that in the case of the investor, there is a benchmark. In a single business investment, in which the investor is the founder and all the capital is deployed in this business, the investor doesn’t usually consider making money above and beyond that of a benchmark. The business owner investor just maximizes profit alone; profit isn’t measured against a standard but is measured in an absolute sense.
In William Sharpe’s ideas about capital asset pricing model (CAPM), the benchmark is the market. However, it comes with a murky definition, usually left for investors to define for themselves. Firms such as Morningstar and Lipper have made a business of measuring portfolio managers’ returns versus their interpretation of what the appropriate benchmark, or market, is. People pay for this interpretation, and the evidence shows that, more than often, portfolio managers do not add value above that of their benchmark (Morningstar or Lipper’s definition). However, the fund is often classified incorrectly and a very inappropriate market benchmark is applied against which to measure the portfolio manager’s performance. For instance, commonly, the S&P 500 is the designated benchmark and the portfolio might be a large-cap growth fund while the S&P 500 is thought of as a core portfolio, showing neither growth nor value characteristics. Also, large-cap--value portfolios are often compared with the S&P 500. This puts the portfolio manager at a disadvantage, because the assigned Morningstar benchmark is not what the manager actually uses to measure risk against nor is it what the managers design their portfolios to outperform. Style matters. To say that portfolio managers do not add much value above the benchmark when one really means the S&P 500 is misleading, because it is entirely possible that professional managers are beating their benchmarks but not beating the S&P 500, because not every manager’s benchmark is the S&P.
To give you an example of benchmark misclassification, here is a partial list of funds that have core benchmarks listed as their main benchmark at Morningstar, although they actually have clear style bias:
LARGE-CAP VALUE
Valley Forge Fund: VAFGX
Gabelli Equity Income: GABEX
PNC Large Cap Value: PLVAX
LARGE-CAP GROWTH
Fidelity Nasdaq Comp. Index: FNCMX
ETF Market Opportunity: ETFOX
SMALL-CAP VALUE
Fidelity Small Value: FCPVX
PNC Multi-Factor SCValue: PMRRX
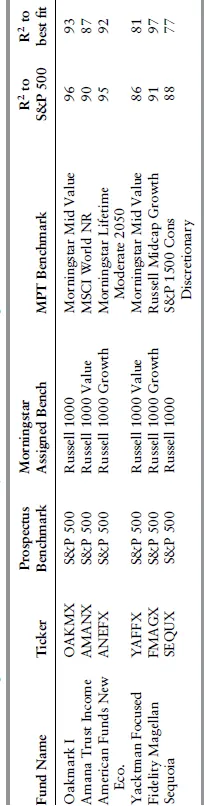
Now Morningstar will also offer other information. For instance, Table 1.1 lists some mutual funds that have several categories of benchmarks listed. In particular, the prospectuses for these funds indicate the managers all compare themselves to the S&P 500, whereas Morningstar preferred to compare them to another benchmark. Then, regressions of the funds’ past 36-month returns were performed (month ending June 30, 2010) against a large group of benchmarks, and the subsequent R2 of the regression is reported. The higher the R2, the more variance of return is explained by the regression and the more alike the mutual fund’s return behavior has been to the modern portfolio theory (MPT) benchmark used in the regression. This demonstrates higher correspondence of return for some other benchmark rather than the one the managers measure themselves against or the one assigned by Morningstar.
TABLE 1.1 Morningstar Listed Mutual Funds with Questionable Benchmark Assignments
In truth, there is nothing technically wrong with the reported numbers. However, it is misleading to investors for a couple of reasons. The first reason is that it violates the law of large numbers. For instance, if you regress the S&P 100 index against a suite of benchmarks, say, 76 randomly selected indexes using the past 36-month returns, it is highly likely that, for any given three-year-return time series, at least one of those benchmarks will have a higher correlation (and R2) than with the S&P 500, with which it shares the top 100 stocks. This would be true for other indexes, too. So, if in that period of time the better fit for the S&P 100 is with the Russell 1000 Growth index, you would believe that there is a style bias to the S&P 100. That would be a completely crazy notion, however.
Table 1.1 shows a real-world example in which Fidelity Magellan (FMR) has a higher R2 to Russell Midcap Growth index rather than the S&P 500. Now, does anybody really believe that the Fidelity Magellan fund is anything other than a large-cap fund that disregards style? It has been run that way since Peter Lynch was its manager. The S&P or Russell 1000 are Magellan’s benchmark simply by its claim in its prospectus that it “is not constrained by any particular investment style.” At any given time, FMR may tend to buy growth stocks or value stocks or a combination of both types.3 Hence, a fund’s benchmark is defined by the methodology employed in its stock selection strategy and portfolio construction process, not by some simple regression vs. returns.
In addition, given that the Morningstar style boxes (large, mid, small, growth, core or blend, value) are their own design, one would think they should know better than to compare a value or growth manager with a core index or benchmark, which is their proxy for the market. Nevertheless, it seems to happen more than often.
The July 12, 2010 issue of Barron’s pours more water on the subject of fund classification by Morningstar. Barron’s reports that, of 248 funds carrying five-star ratings as of December 1999, just four had retained that status through December of 2009, 87 could no longer be found, and the rest had all been downgraded. The point is not to chastise Morningstar as much as it is to point out that critics and watchdogs of professional money managers do not often have such a stellar (pun intended) record. In this particular case, the star ratings have no predictive ability, and it is misleading to investors that they do. Yet the SEC does not have the authority to assess this concern for investors because Morningstar does not manage money.
Now, to qualify these comments, sometimes it does happen that unscrupulous managers pick a benchmark with a design in mind of picking something easier to beat than the proper bench. We would suppose companies like Morningstar and Lipper shine the spotlight on these kinds of behaviors, because, if a stated benchmark is the Russell Midcap Value index and the fund’s past returns have an R2 with the EAFE index (a large-cap international index), that is 20 points higher than the Mid Cap Value index. Clearly, there is something corrupt here, and one should be on guard against what the manager says the fund is doing versus what it is actually doing with its investment process. In general, regressing returns against various benchmarks in hopes of trying to better pick the benchmark than the one given in the fund’s prospectus is very much like having a hammer and needing a nail. Sometimes it really is the case that the process acting like a consultant really has only one tool and they are looking for a problem to solve with it, rather than choosing the right tool for the problem.
The regression of returns with an eye toward rightly classifying a fund’s investment objectives is called a returns-based approach. An alternative methodology involves analyzing the holdings of mutual funds rather than examining the returns. If, for instance, a large (by assets under management) mutual fund owns 234 positions, all of which are found in the Russell 2000 value index, and, in addition, it states in its prospectus that the universe of buy candidates come from this index, then you can be sure its benchmark is the Russell 2000 value index and needn’t run any regressions. This would be true regardless of whether its regression of returns is higher against some other index. A holdings-based analysis can offer a different perspective on the objectives of a fund than the returns-based analysis, and vice versa.
Now that we have identified what the market and benchmark are under the guise of CAPM, what is alpha?
THE BEGINNINGS OF THE MODERN ALPHA ERA
So what is alpha and what isn’t it? The initial definition as we know it today comes from Sharpe’s Capital Asset Pricing Model (though some attribute Jack Treynor as inventor or, at a minimum, a co-inventor). To begin, every investment carries two separate risks. One is the risk of being in the market, which Sharpe called systematic risk. This risk, later dubbed beta, cannot be diversified away. Unsystematic risk (idiosyncratic) is another kind of risk, best described as company-specific yet diversifiable. The CAPM implies that a portfolio’s expected return hinges solely on its beta, which is its relationship to the market. The CAPM describes a method for measuring the return that an investor can expect for taking a given level of risk. This was an extension of Markowitz’s thoughts in many ways, because he was Sharpe’s advisor at Rand Corporation and he had a large influence on Sharpe.
Sharpe’s CAPM uses regressed portfolio return (less risk-free return) against the market’s return (also less risk-free return) to calculate a slope and an intercept, which are called beta and alpha. Beta is the risk term that specifies how much of the market’s risk is accounted for in the portfolio’s return. Alpha, on the other hand, is the intercept, and this implies how much return the portfolio is obtaining in and above the market, separate from any other factors.
However, risk is more complicated than just beta, because risk is divided into idiosyncratic or individual company specific risk and risk due to correlations of and within companies. To understand the latter risk, consider a company that creates hardware that is used in some other company’s products, so for example consider an aircraft engine manufacturer. The correlation between an aircraft manufacturer and its suppliers is easily conceived. This can be observed by watching two companies’ stock prices through time. Because their businesses are connected through their products, if the sales of aircraft fall, so do the sales of engines. Their business prospects and earnings are correlated, and this can be observed by visually plotting their stock prices. Statisticians often call this “chi by eye.”
Correlations make risk a complicated feature, and one that people have trouble processing. So having estimates of risk and return, you can input these into a computer and find efficient portfolios. In this way, you can get more return for a given risk and less risk for a given return, and that is beautiful efficiency à la Markowitz. Prior to Markowitz, the investment mantra was simply do not put all your eggs in one basket or put them in a basket and watch them very closely, following the Ben Graham philosophy of weighing the assets in and of the company. There was little quantification. Markowitz and Sharpe brought quantification and mathematical elegance to investing, albeit much to Graham’s chagrin.
The point of the CAPM was to compute a required rate of return of an asset given its level of risk relative to some risk-free rate. In practice, however, it has been reduced to a much simpler interpretation, even though it is wrong. The CAPM offers us an alpha and a beta, which represent the amount of return a portfolio (not an asset) offers above an index or market portfolio. That’s the alpha, while beta represents a twofold interpretation in which neither is really appropriate but it’s widely accepted to mean both whether a stock (or portfolio) is more volatile than the index (or market) and its correlation to the index (or market). Though these definitions come from portfolio managers and analysts and they are both widely accepted and used, neither one fully explains beta. Not to insult Mr. Beta, but he is nothing more than a regression coefficient. Either way, in practice, a stock with beta greater than 1 is expected to have greater volatility than its index, and if it is less than 1, it is expected to have lower volatility than its index. This is usually true but not necessarily so, as subsequent chapters will show. The alpha is what we are after, however. If one has alpha, then this implies that the portfolio-generating process, the underlying investment process, really does have an anomalous return feature associated with it, and it isn’t some risk factor masquerading as alpha.
Although alpha is usually reserved for speaking about portfolios rather than stocks, it can be used for stocks, too. How it is interpreted, however, is important for the majority of financial and institutional consultants reference it all the time, as does Morningstar, Lipper, and other fund-rating agencies. In simple terms, if a portfolio has demonstrated positive alpha, it means that, relative to some index or benchmark, the portfolio has demonstrated outperformance for the same average level of risk (given beta equal to 1) as its index. Portfolios with negative alpha underperform relative to their index or benchmark. It is a relative world here we are talking about, by which we mean performance relative to a benchmark, not cash. It is not absolute return we’re talking about, and this distinction is paramount when it comes to differentiating between long-only institutional asset management, mutual funds and hedge funds. Hedge funds live in an absolute return world, whereas long-only institutional asset management lives in a relative world.
Though academics of finance highly criticize this practitioner’s view of alpha, 95 percent of the people in the asset-management business believe it. And you know what? This interpretation works! For instance, suppose you have three years of monthly returns of a large-cap core (or blend) portfolio and three years of monthly returns to the S&P 500. Now, subtract the benchmark’s returns from the portfolio’s return, and graph this excess return vs. the benchmark’s return. The slope is beta and the intercept is alpha (approximately; strictly speaking, you need to subtract out the risk-free return beforehand). If the alpha is positive, you have a good portfolio that outperforms its index, and if, simultaneously, the slope (beta) is less than 1, you obtained that return for less risk than its index, too—or so it is interpreted.
IMPORTANT HISTORY OF INVESTMENT MANAGEMENT
Why is alpha so earnestly sought after in modern quantitative investment management? Alpha is the legacy of focus by most analysts and portfolio managers as ordered by chief investment officers (CIOs) because of the history of the field of investment management. In the early days, analysts performed portfolio management, and management meant reading, digesting, and regurgitating balance-sheet information. Prior to 1929, the assets of a firm were the most important consideration, and stock selection was predominately based on how good the book value was. Later, after the 1929 crash, earnings became more important, and Graham, in an article in Forbes, said value has come to be exclusively associated with earnings power, and the investor no longer was paying attention to a company’s assets, even its money in the bank.4 In addition, these early analysts believed (some still do today) that they were ascertaining, by their fundamental analysis, a company’s alpha simultaneously with its risk, and to a certain extent that was true. However, those early analysts never ascertained the co-varying risk this way, only the company-specific risk. This is because the typical fundamental analyst thought of individual companies as independent entities...