![]()
Chapter One
Cutting through the Bull
Exploring the Meaning and History behind Bull and Bear Markets
Have you ever heard the saying “a rising tide lifts all boats”? When referring to economics and the financial markets, it means that everyone does better in prosperous times and most stocks perform well in bull markets. Conversely, all boats drop when the tide goes out. Most folks feel the pain of economic recession and bear markets drive stocks down en masse.
“Financial genius is a rising stock market” is another saying I keep in mind to help contain any bouts of hubris that arise from making accurate market calls. The phrase has been attributed to both the renowned economist John Kenneth Galbraith and the legendary investor Sir John Templeton. Put another way, “don’t confuse brains with a bull market.”
Being in a bull or a bear market has the single greatest influence on stock prices and the value of your investment portfolio. Therefore, it’s critical for investors to know how to identify the two. What happened to your portfolio in 2008? Unless you were a superstar stock-shorting hedge fund manager your portfolio was likely cut in half like those of most investors and even top fund managers. If you panicked early and fast in 2008 like I did you minimized losses and rode out the storm in bonds and cash.
In addition to determining whether you are in a bull market or a bear market, it is equally as important to know what type of bull or bear market it is. Commentators use a lot of different terms to describe the markets and it’s important to know what they are. We are currently in a secular bear market and have been since the year 2000. But what does that mean?
Describing the Markets
Is this the dawn of a new long-term secular bull market? Or is it merely a short-term cyclical bull in the midst of the overarching secular bear market we have been in since 2000? Answering this important question can give us a better understanding of how the market is likely to perform over the near term and the next several years. And if you’re not familiar with the terms used to describe the markets, it’s time to get up to speed.
Let’s start with a couple of important definitions: secular and cyclical. According to the Oxford English Dictionary, “secular” means “of a fluctuation or trend: occurring or persisting over an unlimited period; not periodic or short-term,” and “cyclical” means “belonging to a definite chronological cycle.”
When it comes to the definition of secular and cyclical with respect to the markets, things become cloudy. That’s because financial markets are malleable. Remember that these markets are run by imperfect human beings. Even though much trading is computer generated now, those computers and the software they run were designed and created by emotional creatures with needs, wants, desires, impatience, envy, vengeance, love, hate . . . you get the idea.
Therefore, secular and cyclical stock market patterns fluctuate and adhere to looser rules than many other disciplines. There is much debate over the definitions of bull and bear markets. But put simply, secular markets last a long time, usually 10 years or more. Cyclical markets last less than 10 years, usually less than 5. The longest cyclical market of the twentieth century lasted nearly eight years from October 1990 to July 1998. It was contained in the 1982 to 2000 secular bull market.
The distinguished team at Ned Davis Research (NDR) classifies a bull market as a 30 percent rise in the Dow Jones Industrial Average after 50 calendar days or a 13 percent rise after 155 calendar days. Similarly a bear market requires a 30 percent drop in the Dow Jones Industrial Average after 50 calendar days or 13 percent decline after 145 calendar days. Reversals of 30 percent in the Value Line Geometric Index since 1965 also qualify.
Standard & Poor’s deems a move of plus or minus 20 percent for the equity bull and bear cycles. While the 20 percent equity move is the major criteria, there are other secondary issues (length of time, S&P 500 versus long-term moving averages, etc.) that are also considered.
However, defining secular bull and bear markets requires outside-the-box thinking. By my reckoning, secular markets span a period of about 8 to 20 years. I classify secular bulls as an extended period of years, when the stock market produces successive new highs and higher lows. Secular bears are often impacted by protracted military campaigns and financial crises, and the market is unable to reach a significant new high. (In Chapter Two, we’ll discuss how war and peace impact the market). You can also ascertain the nature of the secular market, bull or bear, by analyzing the cyclical bull and bear markets within it.
Talking in Seculars
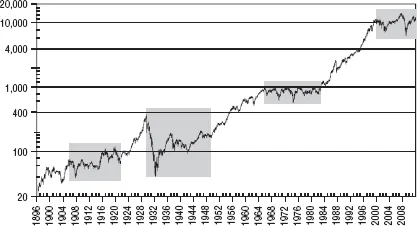
In Figure 1.1 the market is divided into eight secular periods since 1896, which is the year the Dow began. Secular bear trends are highlighted with shaded boxes.
Four secular bull markets ran from 1896 to 1906, 1921 to 1929, 1949 to 1966, and 1982 to 2000. The four bears span 1906 to 1921, 1929 to 1949, 1966 to 1982, and 2000 to the present. We then lined up all the cyclical bulls and bears within the secular bull markets and compared them to those in secular bear markets.
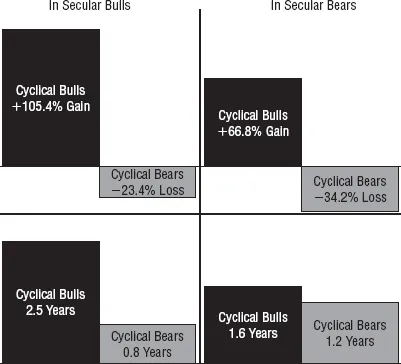
Since 1896, cyclical bulls have averaged Dow gains of 105.4 percent during secular bull markets. Cyclical bulls were 60 percent greater, and nearly twice as long on average, as in secular bears. Cyclical bears on average were 50 percent worse and about two times longer in secular bears. (See Figure 1.2.)
For perspective, cyclical bulls have been weaker in secular bears since World War II. World War II created a tectonic shift in the economy and marketplace. Before the war the United States was predominantly a farming economy, but afterward it was a military-industrial complex, a technology powerhouse. What the United States becomes next remains to be seen.
In general, secular bulls are marked by short and timid cyclical bears and long, powerful cyclical bulls. Conversely, secular bears exhibit weak, fleeting cyclical bulls and protracted cyclical bears teeming with sharp, nasty sell-offs; failed rebounds; capitulation; brutish trading at bottoms; and often a lack of interest in stocks by the public.
We deem the current market since the top in 2000 a secular bear market. Since the year 2000, the Dow has had four cyclical bear markets of 29.7 percent, 31.5 percent, 53.8 percent, and 16.8 percent and three cyclical bulls of 29.1 percent, 94.4 percent, and 95.7 percent through 2011, recording the longest cyclical bull in a secular bear and worst cyclical bear since 1929 to 1932. The 95.7 percent bull move from March 2009 to April 2011 was hefty and was of average length of all cyclical bulls at just over two years long. This is reminiscent of the cyclical bulls during the secular bear from 1929 to 1949 and from 1934 to 1937 and from 1942 to 1946 during World War II. I don’t believe we are in for such a protracted bear as the Great Depression, but I’m not yet convinced we’ve started a new secular bull trend, either.
Let’s Shoot Some Bull
Now that we know the history of bull and bear markets since the Dow began, what we really want to know is when we can expect the next big secular bull that will get us out of the post-financial-crisis funk. The new secular bull will not emerge and lasting prosperity will not take charge until there is an extended period of relative peace.
Part of the problem is that the United States is still entangled in a protracted foreign military campaign in Afghanistan. The good news is that our presence in Afghanistan is winding down. And with Bin Laden gone and the “Arab Spring” blossoming, the broader war on terror is at bay. We can’t be naïve and think that our problems in that region of the world and other hotspots are over, but at least massive military combat troop deployment is down and no longer monopolizes our headlines.
This has been the consistent theme in all of the previous secular bear periods: 1906 to 1921 (World War I), 1929 to 1949 (World War II), and 1966 to 1982 (Vietnam). War is not necessarily the initial event that starts the secular bear period, but the market has not begun a new secular bull period until the war is over and the post-war inflation kicks in.
Finally, all of these previous secular bull trends were accompanied by a major paradigm shift from an enabling technology or cultural change. By 1896 the rails had connected the coasts and commerce, trade, and people flowed like never before. In the Roaring Twenties the motion picture industry inspired the planet with the advent of “talkies,” while Lindbergh and Earhart mesmerized the world with trans-Atlantic air travel and automobiles unshackled the middle class.
In the post-World War II bull period, consumerism took hold, the population exploded with the baby boom, and America helped rebuild Europe and Japan. Space projects and countless industrial technology innovations spurred growth and TV connected people around the world. The age of information powered the super bull of the 1980s and 1990s. Personal computers, telecommunications, and the Internet empowered and liberated individuals and society. Only the future will tell what will fuel the next boom.
Seeing What Tomorrow Brings
Where does that leave us today? Since there does not appear to be a new enabling technology or cultural shift on the horizon and the U.S. military is still deeply involved overseas, it’s not yet clear.
Perhaps when we finally exit Iraq and Afghanistan, provided we have not just moved our armed forces over to Iran or somewhere else, and a new game-changing innovation or way of life ignites the planet, then we will begin a new secular bull trend. For now, we will most likely remain trapped in the current trading range and are poised for a cyclical bear market or two in this secular bear trend that could bring us down 20 to 30 percent over the next five or six years.
At a Glance
- Being in a bull or bear market is the single greatest infl uence on stock prices.
- Secular market trends are long-term, usually lasting 8 to 20 years. Cyclical market trends are shorter-term, lasting anywhere from a few months to several years.
- During secular bull markets, cyclical bear markets are mostly short and shallow. Cyclical bull markets are long and strong.
- During secular bear markets, cyclical bulls are usually brief and mild. Cyclical bear markets are dragged out and deep.
![]()
Chapter Two
War and Peace
How War and Peace (and Inflation) Impact the Market
Without a doubt, the single most important enduring influence on the stock market is war. For as long as the United States has been embroiled in a significant and lasting military combat operation, the stock market has failed to make any significant headway. And so it bodes well for the markets that more than a decade of foreign conflict following the September 2001 terrorist attacks is drawing to an end.
But this is not just true for today’s markets. The impact of war and peace and inflation has been the driving force in creating the cycle of booms and busts for the past two centuries and beyond. What makes the market range-bound during wartime and causes it to rise during peacetime? The answer is inflation. The government empties the treasury during a war. It also focuses on foreign or war-related issues rather than domestic concerns and the economy. The result is a sustained rise in inflation. Only after the economy settles down and the country refocuses on domestic issues does the stock market soar to new heights.
Creatures of Habit
Human history is replete with episodes of economic booms and busts and the rise and fall of societies. For millennia, starting well before the Common Era, complex civilizations produced massive structures, innovative technology, and cultural feats of education, literature, math, science, and philosophy only to suffer their own demise. Rome fell, the Dark Ages shrou...