![]()
one
Urban Air Pollution in Asia
INTRODUCTION
Urban air pollution affects the health, well-being and life chances of hundreds of millions of men, women and children in Asia every day. It is responsible for an estimated 537,000 premature deaths annually with indoor air pollution being responsible for over double this number of deaths (WHO, 2002). It is often the poor and socially marginalized who tend to suffer disproportionately from the effects of deteriorating air quality due to living near sources of pollution (Martins et al, 2004; Gouveia and Fletcher, 2000; Stern, 2003). The ubiquitous Asian street hawker who sits beside strategic road junctions experiencing the general hustle and bustle of daily life and traffic is being exposed to high concentrations of motor vehicle pollutants increasing the risk of developing respiratory disease and cancer (Chakraborti, 2003). Children ill with respiratory disease caused by exposure to high concentrations of air pollutants will be children who will not learn very well, will suffer in adult life from low levels of qualifications and skills, which in turn has implications for their quality of life and the economic development of the country as a whole.
Levels of air pollution in Asian cities regularly exceed World Health Organization (WHO) recommended guidelines with smoke and dust particles being double the world average (WHO, 2000a; 2005). The main cause of urban air pollution is the use of fossil fuels (coal, oil and natural gas) in transport, power generation, industry and domestic sectors. In addition, the burning of biomass such as firewood, agricultural and animal waste also contributes to pollution levels. Pollutant emissions have direct and indirect effects (e.g. acidification, eutrophication, ground-level ozone, stratospheric ozone depletion) on air quality with a wide range of impacts on human health, ecosystems, agriculture and materials.
The severity of air pollution problems in Asian cities reflects the level and speed of their economic development and the effectiveness of past air quality management (AQM) and current efforts. Each city is unique in terms of its economic, physical and social characteristics which influence the spatial and temporal patterns of emission sources and air pollution problems.
To gain an understanding of urban pollution in Asia it is necessary to understand the economic development context and the key factors which influence the emission of air pollutants. This chapter examines the development of air pollution problems and the key drivers and pressures of air pollution which affect the current state of air quality. It discusses the key impacts on human health and environment and provides an overview of the measures taken to address air pollution in the region.
DEVELOPMENT OF AIR POLLUTION PROBLEMS
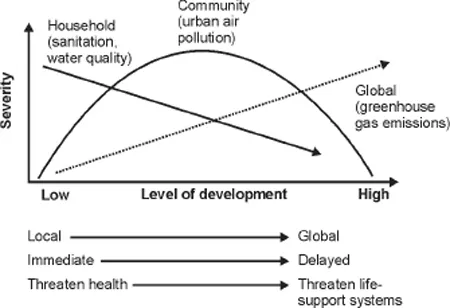
As cities undergo economic development the environmental risks to human health generally decline both in absolute and relative terms with different types of risks tending to dominate each phase of development, moving from the household to community and global scale (Smith, 1997; McGranahan et al, 2001) (see Figure 1.1).
Figure 1.1 Urban environmental transition model
Source: Smith (1997); McGranahan et al (2001)
In poor cities, household sanitation, water quality and fuel quality are usually severe problems. Before rapid industrial development, the main source of air pollution is from domestic and low-scale commercial activities. The concentration of air pollution is generally low and it increases as the population increases. As cities develop and undergo industrial development, urbanization and motorization the community risk from urban activities increases. Outdoor air quality becomes a serious public health issue as carbon emissions increase and the severity of the household sanitation problem decreases. As countries develop further, environmental controls are tightened and community-level risks (urban air pollution) tend to decline. In wealthy cities strict regulation and the implementation of abatement technology reduce polluting emissions to ensure they meet health guidelines, but this is not without considerable financial cost to the community. This decline in community risk leads to the richest countries contributing the most to global risks such as global climate change due to greenhouse gas emissions on a per capita basis. For example, in 2002, the carbon dioxide (CO2) emissions per capita for North America, Western Europe and Centrally Planned Asia (mostly China) amounted to 1.7, 0.7, and 1.0 trillion metric tons, respectively. However, the absolute CO2 emissions per capita were 5.42, 2.05 and 0.73 metric tons of carbon respectively, illustrating that the CO2 emissions from Europe and China together are one-half of the North American emissions (Maryland et al, 2005).
The trends in environmental risk at the household, community and global scales across the development process generally support the environmental risk model (Smith and Ezzati, 2005). While there can be significant local departures from this overall trend, the urban environmental transition model provides an aid to understanding the development and management of urban environmental problems and the risk they pose to human health.
The Environmental Kuznets Curve
The 1992 World Bank Development Report noted that ‘most forms of pollution ... initially worsen but then improve as incomes rise’ (World Bank, 1992). Following this first model, which demonstrated a relationship between air quality and economic growth, a number of studies have further examined the link between air pollution and economic development (Seldon and Song, 1994; Shafik, 1994; Cole et al, 1997; Goklany, 1999; Gangadharan and Valenzuela, 2001; Hill and Magnani, 2002; Cole, 2003). These studies established that the relationship consisted of an inverse U-shape curve, called the Environmental Kuznets Curve (EKC).
The EKC describes the relationship between levels of environmental quality and national economic development. It suggests a certain inevitability of environmental degradation as a country develops, especially during the early stages of industrialization. As the city develops, there is an increase in the use of natural resources, pollutant emissions, use of inefficient and relatively dirty technologies and a high priority is given to material output with a disregard for the environment (Smith, 1997; McGranahan et al, 2001). With increasing energy and resource use, industrialization and motorization, ambient air quality becomes a serious public health problem.
As economic growth continues and life expectancy and income increase, the general public place a greater value on environmental quality and demand better environmental protection (Hettige et al, 1992; Antle and Heidebrink, 1995). Environmental controls are tightened and community-level risks such as urban air pollution tend to decline. In the post-industrial stage, cleaner technologies and a move to information and service-based activities combine with a growing ability and willingness to improve environmental protection (Lindmark, 2002; Munasinghe, 1999).
While the EKC curve is a good model for the link between environmental change and income growth, this is not necessarily applicable to all types of air pollutants (Yandle et al, 2004). Ozone (O3), nitrogen oxides (NOx) and particulate matter (PM) are pollutants of concern (Lenzen et al, 2006). In addition, improvements in air quality with income growth are not inevitable but are dependent on government policies, social institutions and the functioning of the economy. Therefore, it is important to establish appropriate institutions as well as transboundary approaches to air pollution (Arrow et al, 1995). In countries where the general public have political power, and civil as well as economic rights, air quality improves (Torras and Boyce, 1998).
Development of urban air pollution
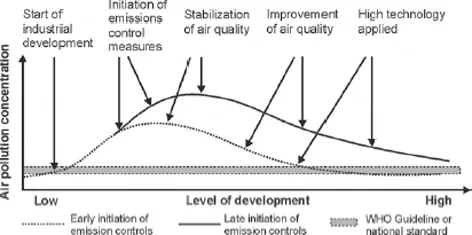
Many Asian governments have recognized air pollution as a key environmental problem that needs to be addressed. Those cities that have been able to introduce emission control early in their development path (e.g. Hong Kong, Tokyo and Singapore) have avoided the extremely high levels of urban pollution that are often associated with other cities that have introduced emission control measures later. The earlier integrated AQM systems are introduced, the lower the maximum pollution levels that will occur (UNEP/WHO, 1992). Figure 1.2 relates the development of air pollution problems in cities to their development status (UNEP/WHO, 1992). This general developmental path is one that is current in many cities around the world.
While conventional wisdom expects air pollution to increase as Asian countries undergo economic development, this is not the case for all countries and pollutants. Since the 1990s, sulphur dioxide (SO2) emissions in Asia have declined, mostly due to a reduction of SO2 emissions in China (Sinton and Fridley, 2000). China has decreased its emissions of SO2 from 23.8 million tons in 1995 to 20 million tons in 2000. This decrease is due to a general reform of industry and power generation including a substantial decline in industrial high-sulphur coal use and an improvement in energy efficiency and economic growth (Cofala et al, 2004). The reduction of particular pollutants (e.g. NOx, PM and O3) has been slow in some Asian countries due to an increase in the number of vehicles, which offsets the emission reductions achieved by improved vehicle technology.
Figure 1.2 Development of air pollution problems in cities
Source: based on UNEP/WHO (1992)
UNDERSTANDING URBAN AIR POLLUTION
As the wealth of a city increases so do the key driving forces. These are mainly road transport, power and heat production, industry and agriculture. In some countries such as China, where climatic conditions require space heating at least in the northern provinces, domestic air pollution may be significant in the urban and rural areas. These sectors create a pressure on the environment in the form of emissions of air pollutants, which affect the state of air quality.
Once released into the atmosphere, air pollutants undergo chemical reactions resulting in a wide variation in pollutant concentrations with time and location and corresponding exposure of the population. Pollutants such as SO2, NOx and carbon monoxide (CO) typically occur in high concentrations close to their sources (e.g. streets and industrial plants) and show low concentrations elsewhere (EEA, 2003). A pollutant such as O3 and the deposition of acidic compounds can occur over larger areas (both rural and urban) which can result in high regional background concentrations (Vingarzan, 2004). Particulate matter (PM2.5 and PM10) can also show a rather high regional background level (Hien et al, 2004). Particulate matter (PM) in this context refers to the sum of primary PM and the weighted emissions of secondary PM precursors. Primary PM refers to particles emitted directly to the atmosphere. Secondary PM precursors are pollutants that are partly transformed into particles by photochemical reactions in the atmosphere. In some countries, PM back...