Climate is critical to the world as we know it. The landscape, and the plants and animals in it, are all determined to a large extent by climate acting over long intervals of time. Over geological time, climate has helped to shape mountains, build up the soil, determine the nature of the rivers, and build flood plains and deltas. At least until the advent of irrigation and industrialisation, climate determined food supplies and where human beings could live.
Today, with modern technology, humans can indeed live in places where it was impossible before. This is achieved by the provision of buildings and complex infrastructure tuned to the existing climate, such as urban and rural water supplies, drainage, bridges, roads and other communications. These involve huge investments of time and money. Trade, particularly of food and fibre for manufactured goods, has also been strongly influenced by climate. Roads, buildings and towns are designed taking local climate into consideration. Design rules, both formal and informal, zoning and safety standards are developed to cope not just with average climate but also with climatic extremes such as floods and droughts. If the climate changes, human society must adapt by changing its designs, rules and infrastructure – often at great expense.
In broad terms, ‘climate’ is the typical range of weather, including its variability, experienced at a particular place. It is often expressed statistically in terms of averages over a season or number of years of temperature or rainfall and sometimes in terms of other variables such as wind, humidity, and so on. Variability is an important factor. ‘Climate variability’ is variability in the average weather behaviour at a particular location from one year to another, or one decade to another. Changes in the behaviour of the weather over longer time-scales, such as one century to another, are usually referred to as ‘climate change’.
Conventionally, 30-year intervals have been used for calculating averages and estimating weather variability. However, natural climate varies on time scales from year-to-year, through decade-to-decade to longer-term fluctuations over centuries and millennia.
Extreme weather events are part of climate. Their impact is reflected in the design of human settlements and activities (such as farming) so as to be able to survive floods, droughts, severe storms and other weather-related stresses or catastrophes. Because climate can vary from decade to decade, reliable averages of the frequency and magnitudes of extreme events require weather observations over longer periods than the conventional 30 years. Engineers design infrastructure (buildings, bridges, dams, drains, etc.) to cope with extreme weather events that occur on average only once in every 50, 100 or 1000 years. The more serious the consequence of design failure under extreme weather conditions, the longer the time interval considered, for example for a large dam as opposed to a street drain.
Turning up the heat
Climate has changed greatly over geological timescales, as we shall see in Chapter 2. But what is of immediate concern is that climate has shown an almost unprecedented rapid global warming trend in the last few decades.
Since the start of reliable observations in the nineteenth century, scientists from weather services and research laboratories in many countries have examined local, regional and global average surface air and water temperatures, on land and from ships.
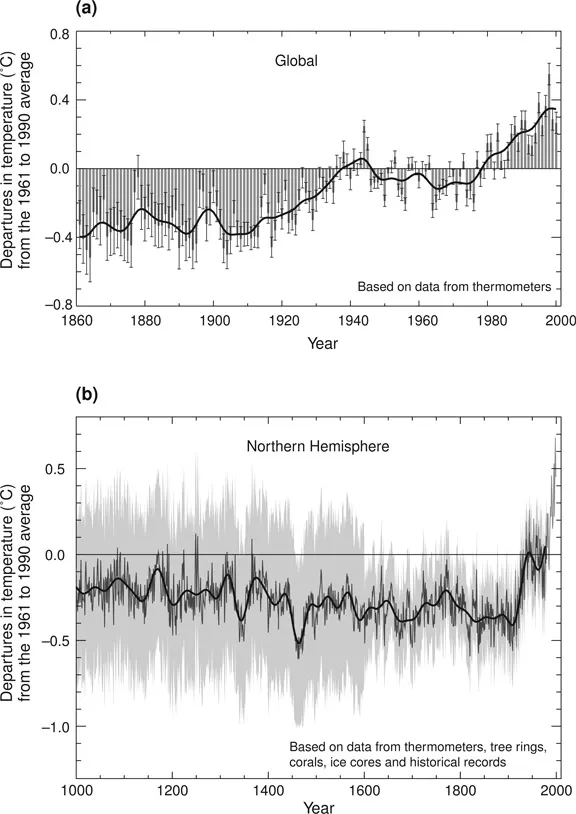
The World Meteorological Organization, which coordinates weather services around the globe, has declared that 2004 was the fourth warmest year since reliable weather records began in 1861, and just warmer than 2003. The warmest year remains 1998, while each of the last 10 years (1995–2004), with the exception of 1996, is one of the warmest 10 years on record. Indirect evidence from tree rings, ice cores, boreholes, and other climate–sensitive indicators (see Chapter 2) indicates that the late twentieth century warming is unprecedented for at least the last 1000 years (see Chapter 2 for a later discussion). Variations of the Earth’s surface temperature for the last 140 years (thermometer measurements), and the last 1000 years (data from thermometers, tree rings, corals, ice cores and historical records) are shown in Figure 1.
Figure 1: Variations of the Earth’s surface temperature. Variations (a) for the last 140 years (global) and (b) the past 1000 years (Northern Hemisphere). (Adapted with permission from IPCC 2001a, Figure 1 of Summary for Policymakers.)
Based on these observations, a critical review by the Intergovernmental Panel on Climate Change (IPCC) in 2001 concluded that the global average surface temperature has increased over the twentieth century by 0.6 ± 0.2ºC.
Note that when scientists give such estimates they usually include a range of uncertainty, which in this case is plus or minus 0.2ºC – that is, the increase could be as low as 0.4ºC or as high as 0.8ºC. Such uncertainties allow for possible inaccuracies in individual measurements, and how well the average from the limited number of individual measurement stations represents the average from all locations.
Two things are notable about this IPCC conclusion. First, it shows that a warming of at least 0.4ºC (that is, 0.6 minus 0.2ºC) almost certainly occurred. Second, the value of 0.6ºC, while it may appear to be small, is already a sizeable fraction of the global warming of about 5ºC that took place from the last glaciation around 20,000 years ago to the present inter-glacial period (which commenced some 10,000 years ago). Prehistoric global warming led to a complete transformation of the Earth’s surface, with the disappearance of ice sheets, and massive changes in vegetation cover, regional extinctions and a sea-level rise of about 120 metres.
Some critics have questioned the IPCC’s estimated warming figures on the following main grounds. First, there are questions of uncertainties due to changes in instruments. Instrumental changes include changes in the housing of thermometers (‘meteorological screens’) which affect the ventilation and radiant heat reaching the thermometers, and changes in ships’ observations from measuring the temperature of water obtained from buckets dropped over the side of ships to measurements of the temperature of sea water pumped in to cool the ships’ engines. These changes are well recognised by scientists and have been allowed for. They contribute to the estimate of uncertainty.
Second, there are concerns that estimates are biased by observations from stations where local warming is caused by the growth of cities (an effect known as ‘urban heat islands’).
The heat island effect is due to the heat absorbed or given out by buildings and roads (especially at night). However, this effect works both ways on observed trends. In many large cities, observing sites, which were originally near city centres (and thus subject to warming as the cities grew) were replaced by observing sites at airports outside the cities. This led to a temporary observed cooling until urbanisation reached as far as the airports. Observations from sites affected by urban heat islands have, in general, been either corrected for this effect or excluded from the averages. A recent study of temperature trends on windy nights versus all nights shows similar warming trends, even though wind disperses locally generated heat and eliminates any heat island effect.
One of the strengths of the surface observations is that those from land surface meteorological stations tend to agree well with nearby ship observations, despite different sources of possible errors. Also average sea surface temperatures show similar trends to land-based observations for the same regions. Airborne observations from balloon-borne radio-sondes at near-ground levels also tend to support the land-based observational trends.
Another issue often raised is the apparent difference between the trends in temperature found in surface observations and those from satellites, which began in 1979. The satellite observations are not straightforward, as corrections are needed for instrumental changes and satellite orbital changes. Moreover, they record average temperatures over the lowest several kilometres of the atmosphere (including the lower stratosphere at mid- to high-latitudes) rather than at the surface, so they do not measure the same thing as surface observations. A recent correction to the satellite estimates to take account of the simultaneous cooling of the lower stratosphere has removed the discrepancy and confirms that surface warming is occurring.
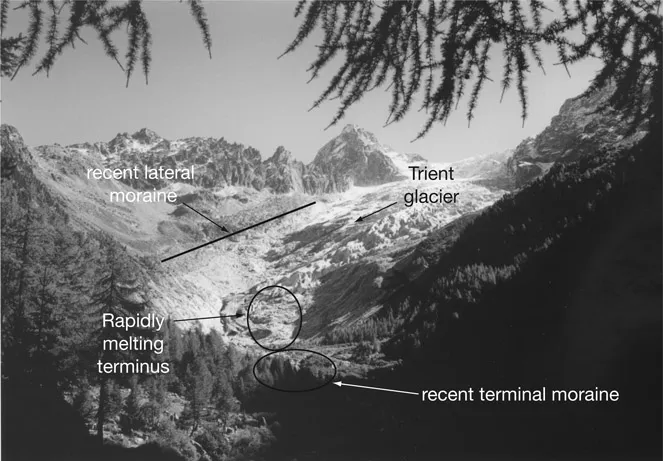
Supporting evidence for recent global warming comes from many different regions and types of phenomena. For example, there is now ample evidence of retreat of alpine and continental glaciers in response to the twentieth century warming (there are exceptions in some mid- to high-latitude coastal locations where snowfall has increased). This retreat has accelerated in the last couple of decades as global warming has accelerated. Figure 2 shows dramatic evidence of this for the Trient Glacier in the Valais region of southern Switzerland. The surviving glacier is in the upper centre, extending right to the skyline. Measured retreat of the terminus of the glacier since 1986–87 is roughly 500 metres. Early twentieth century terminal and lateral moraines (where rock and earth are dumped by the glacier) are evident, free of trees, indicating recent ice retreat, and the present terminus of the glacier is slumped, indicating rapid melting.
Changes in other aspects of climate, broadly consistent with global warming, have also occurred over the last century. These include decreases of about 10% in snow cover as observed by satellites since the 1960s, and a 10 to 15% decrease in spring and summer sea-ice since the 1950s in the northern hemisphere. Warming has also been rapid near the Antarctic Peninsula, although not around mainland Antarctica.
Observed melting of permafrost is documented, especially for Alaska, by the US Arctic Research Commission in its Permafrost Task Force Report in 2003, along with recommendations for further observations and research. Similarly, the NASA Earth Observatory has documented increased summer melting of ice on the Greenland Ice Cap, which shows a melting trend since 1979, only interrupted in 1992 by the effects of the volcanic eruption of Mt Pinatubo. Extreme melt years were 1991, 1995 and 2002. Observed changes in the Arctic are summarised in Box 1.
Figure 2: The Trient Glacier near Forclaz in the Valais region of southern Switzerland in 2000. Rapid retreat has occurred during the latter part of the twentieth century. (Photograph by A.B. Pittock.)
Other changes include rapid recession of the ice cap on Mt Kilimanjaro in Kenya and other tropical glaciers in Africa, New Guinea and South America, as well as glaciers in Canada, the United States and China. Permafrost is melting in Siberia (where it has caused problems with roads, pipelines and buildings) and in the European Alps (where it has threatened the stability of some mountain peaks and cable car stations due to repeated melting and freezing of water in crevices in the rocks, forcing them apart). Catastrophic release of water dammed behind the terminal moraines of retreating glaciers in high valleys is of increasing concern in part of the Himalayas, notably Bhutan and Nepal, according to a United Nations Environment Program report. All of these phenomena have accelerated in recent decades.
Measurements of the Southern Patagonian ice sheet in South America indicate accelerated melting by a factor of two since 1995, with the current rate of melting being about 42 cubic km per year, which is equivalent to 1 mm per decade rise in global average sea level.
A decrease in sea-ice extent in the Arctic spring and summer of 10 to 15% since the 1950s is consistent with an increase in spring and, to a lesser extent, summer temperatures at high northern latitudes. There is little indication of reduced Arctic sea-ice extent during winter despite warming in the surrounding regions. Antarctic sea-ice extent has fluctuated in recent decades but remained fairly stable, apart from the area around the Antarctic Peninsula where rapid regional warming has led to sea-ice retreat and the disintegration of several large semi-permanent ice shelves attached to the mainland (see Figure 17).
Box 1: Observed changes in the Arctic
Highlights of presentations at the final conference on the Arctic Climate System Study, in St. Petersberg, November 2003, included:
- The Arctic experienced very strong warming during the last 30 years in concert with global trends.
- Some evidence suggests that a recent freshening of the sub-Artic seas might be a local expression of a change in the global water cycle.
- Satellite microwave data reveal that Arctic sea ice extent has decreased by 2.5% per decade since 1972, with September (the seasonal minimum) showing the largest decrease.
- Arctic sea ice has thinned substantially over the last 20–40 years in most deep-water areas, especially in summer.
- In 2002, the Greenland ice sheet experienced the most extensive melt since satellite observations began in 1980.
- River runoff into the Arctic Ocean has increased significantly during recent decades and the river ice season has shortened.
- There has been a northward movement of the Arctic tree line since the late 1950s, particularly in north-west Canada and eastern and coastal Siberia.
Source: Thierry Fichefet and others, EOS, Vol.85, 20 April, 2004.
Global warming has led to thermal expansion of the ocean waters as well as melting of mountain glaciers. John Church, from CSIRO in Australia, and colleagues recently compared model calculations of regional sea-level rise with observations from tide gauge and satellite altimeter records. They concluded that the best estimate of average sea-level rise globally for the period 1950 to 2000 is about 1.8 to 1.9 ± 0.2 mm per year (that is just under 10 cm), and that sea-level rise is greatest (about 3 mm per year or 30 cm per century) in the eastern equatorial Pacific and western equatorial Indian Ocean. Observed rates of rise are smallest (about 1 mm per year) in the western equatorial Pacific and eastern Indian Ocean, particularly the north-west coast of Australia. Regional variations are weaker for much of the rest of the global oceans, and are due to different rates of warming in different parts of the oceans, and changes in winds, currents and atmospheric pressure.
Evidence for a stren...