
eBook - ePub
World Economic Outlook, September 2004 : The Global Demographic Transition
International Monetary Fund. Research Dept.
This is a test
Share book
- English
- ePUB (mobile friendly)
- Available on iOS & Android
eBook - ePub
World Economic Outlook, September 2004 : The Global Demographic Transition
International Monetary Fund. Research Dept.
Book details
Book preview
Table of contents
Citations
About This Book
NONE
Frequently asked questions
How do I cancel my subscription?
Can/how do I download books?
At the moment all of our mobile-responsive ePub books are available to download via the app. Most of our PDFs are also available to download and we're working on making the final remaining ones downloadable now. Learn more here.
What is the difference between the pricing plans?
Both plans give you full access to the library and all of Perlego’s features. The only differences are the price and subscription period: With the annual plan you’ll save around 30% compared to 12 months on the monthly plan.
What is Perlego?
We are an online textbook subscription service, where you can get access to an entire online library for less than the price of a single book per month. With over 1 million books across 1000+ topics, we’ve got you covered! Learn more here.
Do you support text-to-speech?
Look out for the read-aloud symbol on your next book to see if you can listen to it. The read-aloud tool reads text aloud for you, highlighting the text as it is being read. You can pause it, speed it up and slow it down. Learn more here.
Is World Economic Outlook, September 2004 : The Global Demographic Transition an online PDF/ePUB?
Yes, you can access World Economic Outlook, September 2004 : The Global Demographic Transition by International Monetary Fund. Research Dept. in PDF and/or ePUB format. We have over one million books available in our catalogue for you to explore.
Information
Publisher
INTERNATIONAL MONETARY FUNDYear
2004ISBN
9781589064065
CHAPTER I. ECONOMIC PROSPECTS AND POLICY ISSUES
Over the past year, the global recovery has become increasingly well established, with global GDP growth now projected to average 5 percent in 2004, the highest for nearly three decades (Figure 1.1 and Table 1.1). That said, growth momentum has slowed from the second quarter of 2004, notably in the United States, Japan, and China, while oil prices have risen sharply. Looking forward, the global expansion—while still solid—will therefore likely be somewhat weaker than earlier expected; the balance of risks has shifted to the downside with further oil price volatility a particular concern. On the policy side, interest rates will need to rise further as the recovery proceeds, although the pace and timing vary considerably across countries, depending on their relative cyclical positions. However, the key challenge—perhaps even more important in light of the somewhat less favorable short-term situation—is to take advantage of the upturn to make progress in addressing fundamental medium-term problems, including difficult fiscal positions, growth-restraining structural weaknesses, financial and corporate vulnerabilities, and—last but not least—continuing global current account imbalances. While progress is being made, it is generally limited; without further action there is a serious risk of shortfalls in many regions, leaving the world significantly more vulnerable to the shocks it will inevitably face in the future.
Table 1.1. Overview of the World Economic Outlook Projections
(Annual percent change unless otherwise noted)
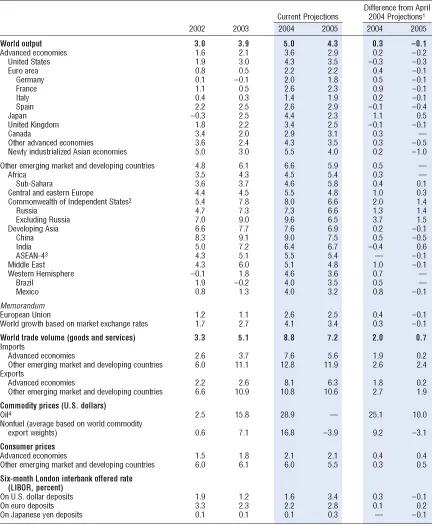
Note: Real effective exchange rates are assumed to remain constant at the levels prevailing during July 7–August 4, 2004.
1 Using updated purchasing-power-parity (PPP) weights, summarized in the Statistical Appendix, Table A.
2 Mongolia, which is not a member of the Commonwealth of Independent States, is included in this group for reasons of geography and similarities in economic structure.
3 Includes Indonesia, Malaysia, the Philippines, and Thailand.
4 Simple average of spot prices of U.K. Brent, Dubai, and West Texas Intermediate crude oil. The average price of oil in U.S. dollars a barrel was $28.89 in 2003; the assumed price is $37.25 in 2004 and $37.25 in 2005.
Global Indicators 1
(Annual percent change unless otherwise noted)
Global growth in 2004 will be the most rapid in nearly three decades, with a slower, but still solid, expansion projected for 2005.
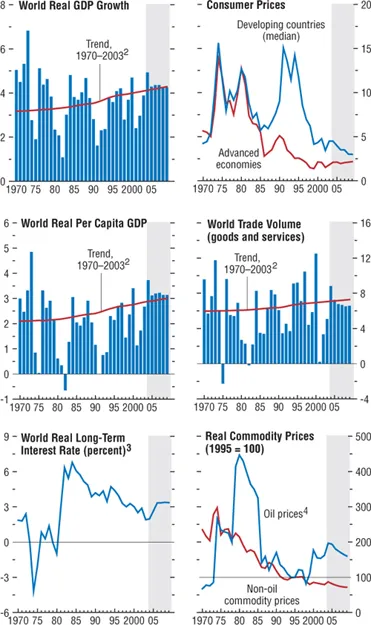
1 Shaded areas indicate IMF staff projections. Aggregates are computed on the basis of purchasing-power-parity weights unless otherwise noted.
2 Average growth rates for individual countries, aggregated using purchasing-power-parity weights; the aggregates shift over time in favor of faster growing countries, giving the line an upward trend.
3 GDP-weighted average of the 10-year (or nearest maturity) government bond yields less inflation rates for the United States, Japan, Germany, France, Italy, the United Kingdom, and Canada. Excluding Italy prior to 1972.
4 Simple average of spot prices of U.K. Brent, Dubai, and West Texas Intermediate crude oil.
Over the past year, the global recovery has become increasingly well established. Between mid-2003 and mid-2004, global growth has averaged 5 percent—well in excess of the 4 percent historical trend—with strong growth in industrial countries and exceptionally rapid expansion in emerging markets, notably China. This has been accompanied by a strong upturn in industrial production and global trade flows; a pickup in private consumption growth, underpinned by generally improving labor market conditions; and continued strength in investment, as post-bubble corporate balance sheet restructuring has proceeded (Figure 1.2). While global growth in the first quarter was much stronger than earlier expected, the momentum of the recovery slowed thereafter. While some slowdown was both inevitable and desirable following three quarters of exceptionally rapid expansion, GDP growth in several major countries—including the United States and Japan— fell below expectations, raising concerns of an emerging “soft patch.” GDP growth in China also eased—a welcome development, given concerns about incipient overheating—although recent data suggest a soft landing is not yet assured.
Current and Forward-Looking Indicators
(Percent change from previous quarter at annual rates unless otherwise noted)
Industrial production and global trade growth have slowed somewhat recently, but remain strong; forward–looking indicators in particular suggest a continued solid recovery.
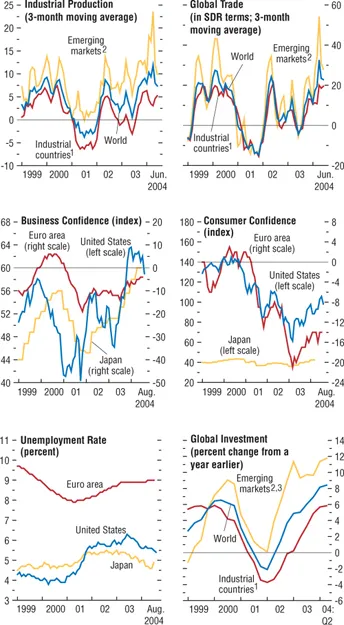
Sources: Business confidence for the United States, the Institute for Supply Management; for the euro area, the European Commission; and for Japan, Bank of Japan. Consumer confidence for the United States, the Conference Board; for the euro area, the European Commission; and for Japan, Cabinet Office. All others, Haver Analytics.
1 Australia, Canada, Denmark, euro area, Japan, New Zealand, Norway, Sweden, Switzerland, the United Kingdom, and the United States.
2 Argentina, Brazil, Bulgaria, Chile, China, Colombia, Czech Republic, Estonia, Hong Kong SAR, Hungary, India, Indonesia, Israel, Korea, Latvia, Lithuania, Malaysia, Mexico, Pakistan, Peru, the Philippines, Poland, Romania, Russia, Singapore, Slovak Republic, Slovenia, South Africa, Taiwan Province of China, Thailand, Turkey, Ukraine, and Venezuela.
3 Data for China, India, Pakistan, and Russia are interpolated.
From a regional perspective, the recovery has become increasingly broad based, but some regions continue to grow more vigorously than others. Despite the weakness in the second quarter, global growth continues to be driven by the United States, with strong support from Asia; activity in Latin America and some other emerging markets has also picked up strongly. The recovery in the euro area is becoming more established, but remains relatively weak and is heavily dependent on external demand (particularly in Germany, which comprises one-third of the euro area). Despite stronger growth outside the United States, the U.S. current account deficit has continued to deteriorate over the past year, offset by higher surpluses in Japan and the euro area. Current account surpluses in emerging Asia have remained very high—notwithstanding generally strengthening domestic demand— aided by buoyant electronics exports but also by the competitiveness of exchange rates in that region.
Buoyant global demand, accompanied increasingly by a variety of supply-side factors, has led to a strong pickup in commodity prices, which have risen by 27 percent in SDR terms since December 2003 (Appendix 1.1). In the oil market, prices have risen sharply, underpinned by a combination of surging demand and—par-ticularly from the second quarter—supply-side concerns in several major oil-exporting countries, including Iraq, Russia, and Venezuela (see Appendix 1.1 for a detailed discussion). This has been exacerbated by low excess capacity and speculative activity. Amidst considerable volatility, oil prices peaked at $44.71 a barrel on August 19 (a record high in U.S. dollar terms, although well below past peaks in real terms— see Figure 1.1). Thereafter, oil prices initially fell back, partly reflecting easing geopolitical concerns, but since mid-September have turned up once more. In contrast, nonfuel commodity prices, which rose substantially through early 2004, have since shown signs of easing, partly owing to slowing growth in China (which accounts for a substantial proportion of global consumption of some key commodities).
The sharp rise in oil prices has contributed to the weakening of the expansion in recent months, and will likely continue to do so for several quarters. To date, however, the overall impact appears moderate. As of early September, futures markets suggest that average oil prices in 2005 will be about $8 a barrel higher than in 2003; standard economic models suggest that such an increase would reduce global GDP by about ½ percentage point.1 In contrast to previous episodes, the rise in oil prices has owed much to stronger global demand rather than supply concerns (although this has been less the case since the first quarter); and consumer confidence, which fell significantly in earlier episodes, has so far held up reasonably well. From a regional perspective, as discussed in more detail in Appendix 1.1, the impact of higher oil prices varies significantly, depending on—among other things—the energy intensity of production and consumption; the impact on the terms of trade; and the flexibility with which the economy adapts to shocks. Among industrial countries, the impact is somewhat larger in the United States and the euro area than in Japan and the United Kingdom. Among developing countries, oil producers clearly benefit; in aggregate, the adverse impact is largest in emerging Asia and Europe, and relatively small in Latin America. The impact on the poorest oil-importing countries—particularly in Africa and the Commonwealth of Independent States—is of particular concern, although in a number of cases it has been partly or fully offset by higher nonfuel prices (Figure 1.3).
Trade Gains and Losses from Commodity Price Movements Between 2003 and 20041
(Percent of GDP)
The impact of higher oil prices on many developing countries has been broadly offset by rising nonfuel commodities prices, although some countries–particularly in Africa and the CIS–have been harder hit.
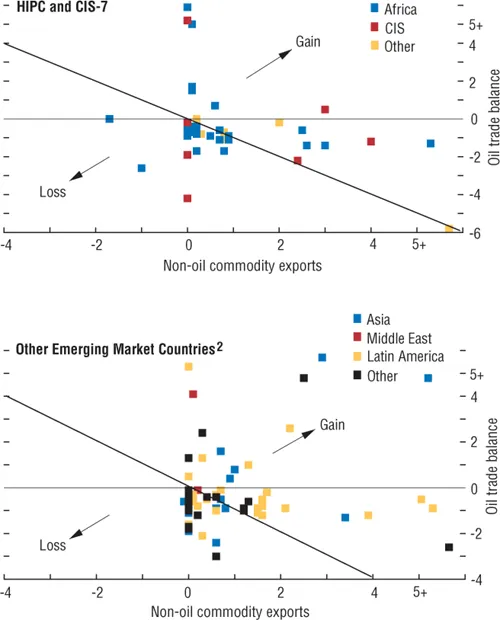
Source: IMF staff estimates.
1 The figure shows the impact of the projected rise in commodity prices between 2003 and 2004 on nonfuel exports (horizontal axis) and the oil trade balance (vertical axis).
2 Excluding oil exporters.
After falling to unusually low levels in mid-2003, inflation across the world has turned up, with earlier concerns about deflation replaced by fears that inflation is making a comeback. Headline inflation has inevitably increased with higher oil prices, but in a number of countries— including the United States—core inflation has also picked up, in part reflecting temporary or one-off factors, as well as higher prices of crude and intermediate materials (Box 1.1, pp. 16–18). Inflationary risks vary across countries and regions, but in most appear moderate, given substantial excess capacity in many countries; generally moderate wage settlements relative to productivity growth; strong corporate profitability, particularly in the United States, providing scope for firms to absorb price pressures; and reasonably well-anchored inflationary expectations (Table 1.2). Even so, central banks will need to be vigilant to ensure that the second-round effects of higher headline inflation are well contained, a task that will be easier in those countries where central bank credibility is well established.
Table 1.2. Advanced Economies: Real GDP, Consumer Prices, and Unemployment
(Annual percent change and percent of labor force)
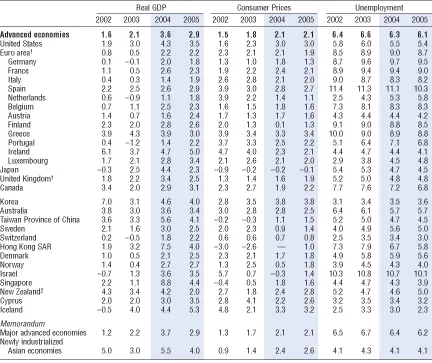
1 Based on Eurostat’s harmonized index of consumer prices.
2 Consumer prices excluding interest rate components.
Box 1.1.
Is Global Inflation Coming Back?
Over the past 15 years, global consumer price inflation has been reduced dramatically, in advanced and developing countries alike, underpinned by a combination of more effective and independent central banking institutions and, just as important, the pressures from globalization (Appendix 2.1 of the April 2002 World Economic Outlook; and Rogoff, 2003). As of 2003, only three countries had annual inflation rates in excess of 40 percent, the level above which it is generally considered to be acutely damaging. In none of the G-7 countries did inflation exceed 3 percent (and in Japan, of course, deflation persisted). Moreover, in many middle-income countries where high inflation had once been almost a permanent feature of the economic landscape, inflation has been brought well into single digits.
Since 2000, annual global headline and core inflation (based on the CPI excluding energy products) has averaged about 3 percent (see the figure), although this historically low figure has masked some volatility.1 In particular, in the middl...