
eBook - ePub
Medical Statistics at a Glance
Aviva Petrie, Caroline Sabin
This is a test
Share book
- English
- ePUB (mobile friendly)
- Available on iOS & Android
eBook - ePub
Medical Statistics at a Glance
Aviva Petrie, Caroline Sabin
Book details
Book preview
Table of contents
Citations
About This Book
Now in its fourth edition, Medical Statistics at a Glance is a concise and accessible introduction to this complex subject. It provides clear instruction on how to apply commonly used statistical procedures in an easy-to-read, comprehensive and relevant volume. This new edition continues to be the ideal introductory manual and reference guide to medical statistics, an invaluable companion for statistics lectures and a very useful revision aid.
This new edition of Medical Statistics at a Glance:
- Offers guidance on the practical application of statistical methods in conducting research and presenting results
- Explains the underlying concepts of medical statistics and presents the key facts without being unduly mathematical
- Contains succinct self-contained chapters, each with one or more examples, many of them new, to illustrate the use of the methodology described in the chapter.
- Now provides templates for critical appraisal, checklists for the reporting of randomized controlled trials and observational studies and references to the EQUATOR guidelines for the presentation of study results for many other types of study
- Includes extensive cross-referencing, flowcharts to aid the choice of appropriate tests, learning objectives for each chapter, a glossary of terms and a glossary of annotated full computer output relevant to the examples in the text
- Provides cross-referencing to the multiple choice and structured questions in the companion Medical Statistics at a Glance Workbook
Medical Statistics at a Glance is a must-have text for undergraduate and post-graduate medical students, medical researchers and biomedical and pharmaceutical professionals.
Frequently asked questions
How do I cancel my subscription?
Can/how do I download books?
At the moment all of our mobile-responsive ePub books are available to download via the app. Most of our PDFs are also available to download and we're working on making the final remaining ones downloadable now. Learn more here.
What is the difference between the pricing plans?
Both plans give you full access to the library and all of Perlego’s features. The only differences are the price and subscription period: With the annual plan you’ll save around 30% compared to 12 months on the monthly plan.
What is Perlego?
We are an online textbook subscription service, where you can get access to an entire online library for less than the price of a single book per month. With over 1 million books across 1000+ topics, we’ve got you covered! Learn more here.
Do you support text-to-speech?
Look out for the read-aloud symbol on your next book to see if you can listen to it. The read-aloud tool reads text aloud for you, highlighting the text as it is being read. You can pause it, speed it up and slow it down. Learn more here.
Is Medical Statistics at a Glance an online PDF/ePUB?
Yes, you can access Medical Statistics at a Glance by Aviva Petrie, Caroline Sabin in PDF and/or ePUB format, as well as other popular books in Medicina & Bioestadística. We have over one million books available in our catalogue for you to explore.
Information
Part 1
Handling data
Chapters
- 1 Types of data
- 2 Data entry
- 3 Error checking and outliers
- 4 Displaying data diagrammatically
- 5 Describing data: the ‘average’
- 6 Describing data: the ‘spread’
- 7 Theoretical distributions: the Normal distribution
- 8 Theoretical distributions: other distributions
- 9 Transformations
1
Types of data
| Learning objectives |
| By the end of this chapter, you should be able to:
Relevant Workbook questions: MCQs 1, 2 and 16; and SQ 1 available online |
Data and statistics
The purpose of most studies is to collect data to obtain information about a particular area of research. Our data comprise observations on one or more variables; any quantity that varies is termed a variable. For example, we may collect basic clinical and demographic information on patients with a particular illness. The variables of interest may include the sex, age and height of the patients.
Our data are usually obtained from a sample of individuals that represents the population of interest. Our aim is to condense these data in a meaningful way and extract useful information from them. Statistics encompasses the methods of collecting, summarizing, analysing and drawing conclusions from the data: we use statistical techniques to achieve our aim.
Data may take many different forms. We need to know what form every variable takes before we can make a decision regarding the most appropriate statistical methods to use. Each variable and the resulting data will be one of two types: categorical or numerical (Fig. 1.1).
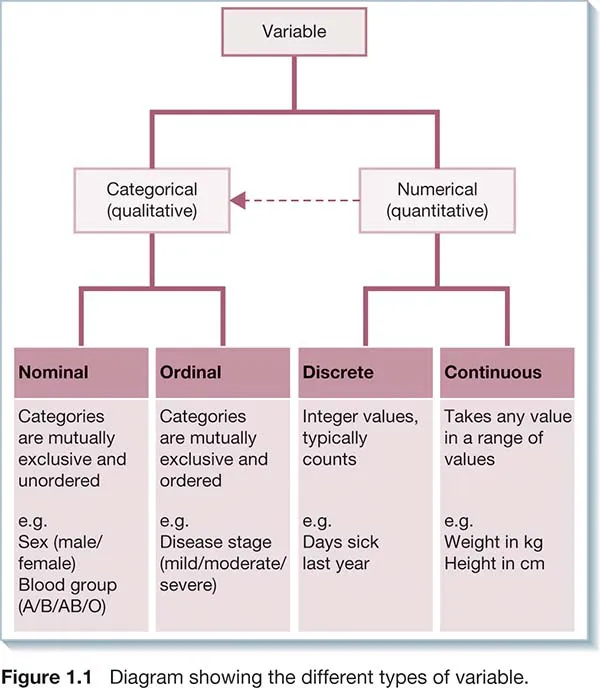
Categorical (qualitative) data
These occur when each individual can only belong to one of a number of distinct categories of the variable.
- Nominal data – the categories are not ordered but simply have names. Examples include blood group (A, B, AB and O) and marital status (married/widowed/single, etc.). In this case, there is no reason to suspect that being married is any better (or worse) than being single!
- Ordinal data – the categories are ordered in some way. Examples include disease staging systems (advanced, moderate, mild, none) and degree of pain (severe, moderate, mild, none).
A categorical variable is binary or dichotomous when there are only two possible categories. Examples include ‘Yes/No’, ‘Dead/Alive’ or ‘Patient has disease/Patient does not have disease’.
Numerical (quantitative) data
These occur when the variable takes some numerical value. We can subdivide numerical data into two types.
- Discrete data – occur when the variable can only take certain whole numerical values. These are often counts of numbers of events, such as the number of visits to a GP in a particular year or the number of episodes of illness in an individual over the last 5 years.
- Continuous data – occur when there is no limitation on the values that the variable can take, e.g. weight or height, other than that which restricts us when we make the measurement.
Distinguishing between data types
We often use very different statistical methods depending on whether the data are categorical or numerical. Although the distinction between categorical and numerical data is usually clear, in some situations it may become blurred. For example, when we have a variable with a large number of ordered categories (e.g. a pain scale with seven categories), it may be difficult to distinguish it from a discrete numerical variable. The distinction between discrete and continuous numerical data may be even less clear, although in general this will have little impact on the results of most analyses. Age is an example of a variable that is often treated as...