eBook - ePub
Geological Storage of CO2
Modeling Approaches for Large-Scale Simulation
- English
- ePUB (mobile friendly)
- Available on iOS & Android
eBook - ePub
Geological Storage of CO2
Modeling Approaches for Large-Scale Simulation
About this book
Despite the large research effort in both public and commercial companies, no textbook has yet been written on this subject. This book aims to provide an overview to the topic of Carbon Capture and Storage (CSS), while at the same time focusing on the dominant processes and the mathematical and numerical methods that need to be employed in order to analyze the relevant systems. The book clearly states the carbon problem and the role of CCS and carbon storage. Thereafter, it provides an introduction to single phase and multi-phase flow in porous media, including some of the most common mathematical analysis and an overview of numerical methods for the equations. A considerable part of the book discusses the appropriate scales of modeling, and how to formulate consistent governing equations at these scales. The book also illustrates real world data sets and how the ideas in the book can be exploited through combinations of analytical and numerical approaches.
Trusted by 375,005 students
Access to over 1.5 million titles for a fair monthly price.
Study more efficiently using our study tools.
Information
Chapter 1
The Carbon Problem
The “carbon problem” refers to the ongoing increase in atmospheric concentrations of the greenhouse gas carbon dioxide (CO2) observed over the last two centuries. This increase is being driven almost entirely by anthropogenic emissions, with most of the emissions associated with combustion of fossil fuels. If humankind decides, at some point, to reduce significantly the anthropogenic emission rate, new or different technologies will almost certainly play a central role. In this book, we are interested in one specific technology: carbon capture and storage (CCS), wherein the CO2 produced from the use of fossil fuels is captured at large stationary sources like power plants and is stored somewhere other than the atmosphere. We are specifically interested in the storage part of this operation, and even more specifically, in geological storage, where the captured CO2 is injected into appropriate geological formations deep underground. Proper analysis of the operations and possible consequences of this kind of injection requires careful mathematical and computational models to predict the system behavior. We focus on such models in this book.
1.1 BACKGROUND
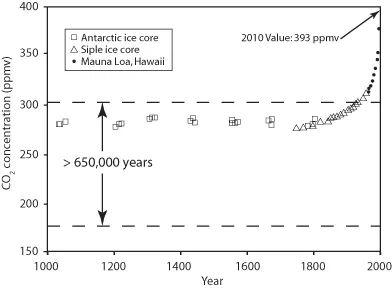
The concentration of CO2 in the atmosphere is naturally dynamic. Figure 1.1 shows the so-called Keeling curve, named after Charles Keeling, who initiated a program of ongoing measurements of atmospheric CO2 in the 1950s. These data show annual cycles of variability superimposed on a monotonic increase over the half century of measurements. Atmospheric concentration of CO2 in the late 1950s was around 315 parts per million (ppm), while today’s concentration has grown to about 390 ppm. To put these numbers into historical context, consider the data shown in Figure 1.2. There the Keeling data, measured at Mauna Loa, Hawaii, are combined with data from ice cores to show atmospheric concentration of CO2 over the last 1000 years. These data show a stable atmospheric concentration of about 280 ppm, which is the concentration to which the atmosphere stabilized at the end of the last ice age. The increase above 280 ppm began with the industrial revolution and has accelerated continuously to the present day. The range of values shown in Figure 1.2, between a low of about 170 ppm and a high of about 300 ppm, indicates the maximum and minimum values of atmospheric CO2 concentration seen in ice core data over the last 650,000 years. In those ice core records, clear 100,000-year cycles of glacial–interglacial periods can be seen, with corresponding maximum and minimum values of atmospheric CO2. From these data, we conclude that the current concentration is about 100 ppm above the “natural” equilibrium associated with the current interglacial period. We also conclude that the current value of 390 ppm is larger, by about 30%, than the highest value seen in at least the last 650,000 years. As such, we humans are collectively performing an interesting global-scale experiment to see how the earth system will respond to significant increases of an important greenhouse gas. The consensus expectation is that these increases will lead to dangerous climate change unless they are reduced or reversed.
Figure 1.1 Atmospheric carbon dioxide as a function of time, measured at Mauna Loa
(modified from wikipedia.org/wiki/Keeling_curve).
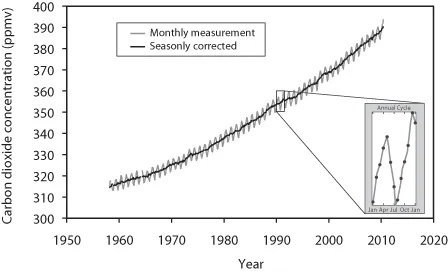
Figure 1.2 Atmospheric carbon dioxide as a function of time, over the past 1000 years. Also shown is the range of CO2 concentrations measured over the past 650,000 years
(modified from http://www.britannica.com/eb/art-69345/Carbon-dioxide-concentrations-in-Earths-atmosphere-plotted-over-the-past).
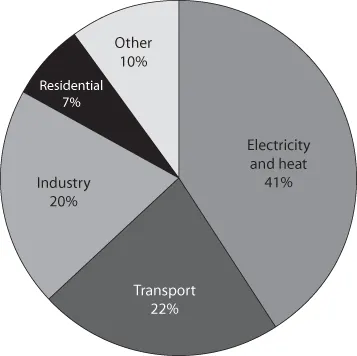
In order to understand the problem, it is helpful to identify the specific sources of anthropogenic CO2 associated with combustion of fossil fuels. Figure 1.3 shows global estimates for the different sources of CO2 emissions, indicating the fraction of total fossil fuel-related emissions coming from each major sector. The dominant source of CO2 emissions is electricity generation, accounting for approximately 40% of emissions, followed by transportation at slightly more than 20%. A recent estimate for total annual anthropogenic emissions (for calendar year 2008) is between 8 and 9 gigatonnes (Gt) of carbon (where 1 Gt C = 1 × 10¹⁵ g of carbon = 1 × 10⁹ metric tones of carbon). The molecular weight of carbon is 12, while the weight of a CO2 molecule is 44; therefore, the conversion factor from carbon to CO2 is 3.67, which means that the global annual anthropogenic emission rate measured in mass of CO2 is about 30 Gt CO2/year. In the remainder of this section we will use 8 Gt C/year as the estimated current emission rate.
Figure 1.3 Fraction of total fossil fuel emissions by sector. Data from the International Energy Agency
(IEA 2010).
Given this profile of emissions, it seems logical that any successful strategy for carbon mitigation will involve decarbonization of electricity generation coupled with associated strategies that may include the use of decarbonized electricity in the remaining sectors. For example, one can consider electrification of the transportation sector and modified designs for both residential and commercial buildings to take advantage of carbon-free electricity. Overall, development of effective solutions to the carbon problem constitutes a grand challenge for the early 21st century.
1.2 STABILIZATION WEDGES AND TECHNICAL SOLUTIONS
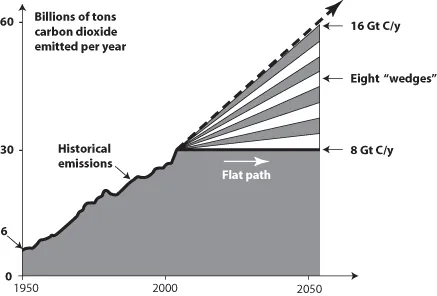
To understand the overall size of the problem and the scales of effort needed to solve it, specific units of measure have been introduced. One that is particularly useful is the so-called stabilization wedge. In their seminal paper from 2004, Pacala and Socolow introduced the concept of stabilization wedges. A stabilization wedge is a unit of measure corresponding to avoidance of emission of 25 Gt C over the next 50 years. The concept arises when a typical “business-as-usual” scenario for future emissions is compared to a so-called “flat path,” where emissions are held constant at their current rate for the next 50 years. With business as usual corresponding to doubling of the current emission rate over the next 50 years, the flat path implies that instead of increasing emission rates to 16 Gt C/year from the current 8 Gt C/year, the rate would instead be held constant at 8 Gt C/year. The concept is shown in Figure 1.4, which is modified from the original figure of Pacala and Socolow (2004), which used the then-current emission rate of 7 Gt/year. We see that the difference of 8 Gt C/year after 50 years can be broken into 8 “slices,” where each slice, or “wedge,” corresponds to emissions avoidance that increases linearly over 50 years to a value of 1 Gt C/year after 50 years. This “slice,” or “wedge,” is indicated on Figure 1.4. Among many other things, Pacala and Socolow (2004) considered a variety of existing technologies and estimated the effort needed to implement those technologies in order to achieve one wedge. A partial list of available technologies, and the associated effort to achieve one wedge worth of emissions avoidance, is given in Table 1.1 (this has also been updated from the original 2004 publication). Notable technologies include nuclear power, which requires addition of twice the current global installed capacity to achieve one wedge; solar photovoltaics, which require about 350 times the global installed capacity (as of 2008) to achieve one wedge; automobile efficiency, which requires 2 billion cars to increase fuel efficiency from 30 miles per gallon (mpg) to 60 mpg (there are currently about 650 million cars worldwide); and installation of a technology called CCS at about 800 large-scale coal-fired power plants. Based on these calculations, Pacala and Socolow (2004) made three important points. The first is that several current technologies exist that can produce at least one wedge of emissions avoidance. The second is that each technology requires an enormous effort to reach one wedge. And the third is that none of the technologies is capable of producing the entire eight wedges needed to achieve the flat path for future emissions. As such, a portfolio of technologies must be used if the carbon problem is to be solved.
Table 1.1 Examples of Technologies and Associated Efforts to Achieve One Wedge
(Updated from Pacala and Socolow 2004)
| Technology | Effort required to achieve one wedge |
| Automobile efficiency | Increase fuel efficiency from 30 mpg to 60 mpg for 2 billion cars (currently there are fewer than 1 billion cars worldwide). |
| Nuclear power | Add twice the currently installed nuclear capacity. |
| Solar power | Add 350 times the currently installed solar power capacity. |
| Wind power | Add 15 times the currently installed capacity of wind-generated electricity. |
| Carbon capture and storage | Install carbon capture and storage at 800 large-scale coal-fired power plants. |
Figure 1.4 Stabilization wedges,
modified from the original presented in Pacala and Socolow (2004),
which used a “current” emission rate of 7 Gt C/year.
When considering energy portfolios of the countries that are the largest emitters, coal plays a central role. Abundant and cheap coal can be found in both the United States and China, which means that coal-fired electricity is likely to be a significant part of the energy portfolio in each country for at least the next several decades. This makes decarbonization of the power grid a problem of use of coal without the CO2 emissions. The only currently available technology to achieve this outcome is CCS. To see the potential impact of CCS technology, we can consider that there are currently about 2100 large coal-fired power plants worldwide. Furthermore, the current rate of construction of new plants in China alone is widely estimated at between one and two plants per week. Both of these numbers imply that a full-scale implementation of CCS coupled with coal has the possibility to contribute several wedges to the overall solution. And, as the Massachusetts Institute of Technology (MIT 2007) report on the future of coal concluded in 2007, “carbon capture and sequestration (CCS) is the critical enabling technology that would reduce CO2 emissions significantly while also allowing coal to meet the world’s pressing energy needs.”
1.3 CCS
As a possible large-scale mitigation strategy for the atmospheric carbon problem, CCS has emerged as a serious option. The concept of CCS is simple: capture the CO2 produced when the chemical energy in fossil fuels is converted to electrical energy, and sequester the captured carbon somewhere other than the atmosphere. The most likely location for large-scale sequestration is in deep geological formations, where the CO2 would be injected into formations that are (1) sufficiently permeable to accept large quantities of CO2 and (2) overlain by very low-permeability formations that will keep the injected buoyant CO2 in place. Deep sedimentary basins are the likely target for large-scale CO2 injections, using some combination of depleted oil and gas reservoirs (with or without enhanced oil recovery), unminable coal seams, and deep saline aquifers (see Figure 1...
Table of contents
- Cover
- Title page
- Copyright page
- Prologue
- Chapter 1 The Carbon Problem
- Chapter 2 Single-Phase Flow in Porous Media
- Chapter 3 Two-Phase Flow in Porous Media
- Chapter 4 Large-Scale Models
- Chapter 5 Solution Approaches
- Chapter 6 Models for CO2 Storage and Leakage
- Epilogue
- Appendix
- Index
Frequently asked questions
Yes, you can cancel anytime from the Subscription tab in your account settings on the Perlego website. Your subscription will stay active until the end of your current billing period. Learn how to cancel your subscription
No, books cannot be downloaded as external files, such as PDFs, for use outside of Perlego. However, you can download books within the Perlego app for offline reading on mobile or tablet. Learn how to download books offline
Perlego offers two plans: Essential and Complete
- Essential is ideal for learners and professionals who enjoy exploring a wide range of subjects. Access the Essential Library with 800,000+ trusted titles and best-sellers across business, personal growth, and the humanities. Includes unlimited reading time and Standard Read Aloud voice.
- Complete: Perfect for advanced learners and researchers needing full, unrestricted access. Unlock 1.5M+ books across hundreds of subjects, including academic and specialized titles. The Complete Plan also includes advanced features like Premium Read Aloud and Research Assistant.
We are an online textbook subscription service, where you can get access to an entire online library for less than the price of a single book per month. With over 1.5 million books across 990+ topics, we’ve got you covered! Learn about our mission
Look out for the read-aloud symbol on your next book to see if you can listen to it. The read-aloud tool reads text aloud for you, highlighting the text as it is being read. You can pause it, speed it up and slow it down. Learn more about Read Aloud
Yes! You can use the Perlego app on both iOS and Android devices to read anytime, anywhere — even offline. Perfect for commutes or when you’re on the go.
Please note we cannot support devices running on iOS 13 and Android 7 or earlier. Learn more about using the app
Please note we cannot support devices running on iOS 13 and Android 7 or earlier. Learn more about using the app
Yes, you can access Geological Storage of CO2 by Michael A. Celia,Jan Martin Nordbotten in PDF and/or ePUB format, as well as other popular books in Technology & Engineering & Chemical & Biochemical Engineering. We have over 1.5 million books available in our catalogue for you to explore.