![]()
1
An Introduction to the Major Asset Classes
This introductory, and slightly eclectic, chapter focuses on the liquid investment asset classes in which derivatives and structured products are normally developed, priced and traded, namely equities, fixed income, commodities and foreign exchange. The aim is not to describe in detail the everyday products traded in these markets but more to give a sense of the general price characteristics of these markets, e.g., how they move through time. There are many excellent product books on the market and we would recommend readers interested in the range of products available to pick up a copy of one of them; we have listed some in the References.
In this chapter, we aim to make some observations on how to model underlying asset price behaviour for each asset class.1 In order to have a real understanding of the value that can be extracted from financial derivatives, one must understand how prices behave in their composite parts. This is not a quantitative finance textbook, however, and we do not aim to be completely rigorous. Instead, in this chapter as in the others, we try to get across an intuitive (rather than an academic) understanding.2
On the way, we will also highlight some interesting features of the markets under review so that you, the reader, can feel more personal affinity with them; we think that, if your interest is tweaked, you will enjoy the book (and the chapter) much more. Many readers of this book will have experience in one or two of these asset classes but probably not all. If short on time, you could, of course, read the sections on the least familiar asset classes and skip the rest. That said, if you do have some experience but you are a little rusty, the following sections should be a good review.
1.1 EQUITIES
1.1.1 Introduction
Equities are perhaps the most familiar of the main asset classes. The shareholder capital or capital stock (or, merely, stock) of a company represents the capital paid into or invested in the business by its shareholders. Along with other assets in the firm, shareholder capital serves as security for the creditors of that company. The capital stock is divided into shares (also called equity). The company may have different types (classes) of equity, each class having distinctive ownership rules, privileges and/or prices.
Equity typically takes the form of common or preferred. Common shares typically carry voting rights, which shareholders can exercise at certain times to influence the company and its directors. Preferred shares typically do not carry voting rights but holders are legally entitled to receive their dividends before other shareholders. Since holders of preferred shares get preferential treatment, they are called preference shares in the UK.
Convertible preferred shares are preferred shares that include an option for the holder to convert them into a fixed number of common shares, usually any time after a predetermined date.
Preferred shares may sometimes have a hybrid structure, having the qualities of bonds (such as a fixed percentage dividend) and common stock voting rights.
1.1 2 Pricing equities
The price of a single stock/share/equity (the terms are interchangeable) is determined as always by the interaction of supply and demand. Factors that impact only on the single stock price are called stock-specific. These factors can include a change in CEO, new patents awarded to the company, new product development, etc. The prices of individual stocks are also influenced by factors that affect the entire equity market, however. These are market-specific. In fact, statistical analysis suggests that the majority of the variation in the prices of individual stocks usually comes about from events that impact the overall equity market, for example changes in monetary policy or the risk tolerance of investors, rather than stock-specific factors. Stocks that tend to move by more than the overall market moves are called high-beta stocks while those that move less than the market are called low-beta stocks. This is essentially a carry-over from the Capital Asset Pricing Model (CAPM),3 which you do not really need to know much about for the purposes of this book. High-beta stocks tend to be in cyclical sectors, such as consumer durables, property and capital equipment. Low-beta stocks tend to be non-cyclical, such as food retailers and public utilities. Another way of describing low-beta stocks is defensive.
To be sure, there is a huge industry dedicated to predicting likely future movements in the price of a single stock or equity market. The three main approaches are fundamental analysis, technical analysis and quantitative analysis. We discuss these techniques below. There are some more esoteric theories of equity price determination, such as those predicated on sun spot activity or the Chinese horoscope, for example. What all these theories have in common, however, is that they have their fans as well as their detractors.
Of course, investors could just ignore forecasting entirely and invest passively, judging that the future direction of price movements is unpredictable in all but the long run. We will say more on this below.
1.1.3 Fundamental analysis
Fundamental analysis attempts to use economics and accountancy to value a single stock or the overall equity market (or sector), thereby obtaining the fair value price. Investors can then compare the actual price with the fair value price and then decide whether the stock price or index level is over- or undervalued. Put simply, analysts attempt to assess the likely flow of cash flows from the company or the market as a whole and discount these using a relevant discount rate. The net present value of the future cash flows is then the equilibrium (or fair value) price of the equity or the overall market.
Although discredited by many, the Efficient Markets Hypothesis (EMH) suggests that equity markets are essentially rational. That is, the price of any stock (and, consequently, market index) at any given moment represents a complete evaluation of the known information that might have a bearing on the future value of that stock. In other words, stock prices are, at any point in time, equal to the sum of the discounted future cash flows. Furthermore, prices can only change if there is some “news” that has an effect on those future cash flows.4 In a sense, the EMH supports the idea of fundamental analysis although there is a chicken-and-egg problem here. The EMH says that fundamental analysis to value a stock or equity market is unnecessary since current stock prices are already at their fair value. But, of course, how did the market arrive at the prices in the first place? Presumably some entity somewhere must be cranking out the numbers?
In recent years, even the most die-hard fans of the EMH have come to accept that the markets are not perfectly efficient, especially the least liquid ones. To quote Professor Robert Schiller, “the Efficient Markets Hypothesis is a half-truth”.
1.1.4 Technical analysis
Technical analysis attempts to predict future price changes in a single stock or the overall equity market (or sector) by analysing past price movements. Technical analysis is extremely popular among certain market participants although there is considerable controversy attached to its use. Certainly, if you subscribe to the school of thought that says that equity markets are efficient, then there is no place for technical analysis. For a more in-depth discussion of this point, see Chapters 10 and 11 of Financial Theory and Corporate Policy (2003) by Copeland, Weston and Shastri.
Whichever approach you prefer, it is irrefutable that stock prices are determined by supply and demand. Although new stock can be issued, for example when a company is wishing to raise new capital for fixed investment, stock prices at the overall equity market level are likely to change from day to day because demand conditions are changing rather than because the net supply of equity is increasing. If equity investors are feeling particularly confident, then they may well allocate more capital to stocks and this will push up prices. On the other hand, if equity investors are feeling much less confident, then they may well take capital out of the stock market and this will push down prices. If changes in the confidence levels of investors are unpredictable, as seems the case empirically, then short-term price changes will tend to be random.5 Of course, fundamental analysts will argue that the market or single stock has temporarily moved away from fair value and recommend buying (if cheap) or selling (if rich). The technical analysts, on the other hand, will try to explain these short-term movements with reference to past price patterns.
1.1.5 Quantitative analysis
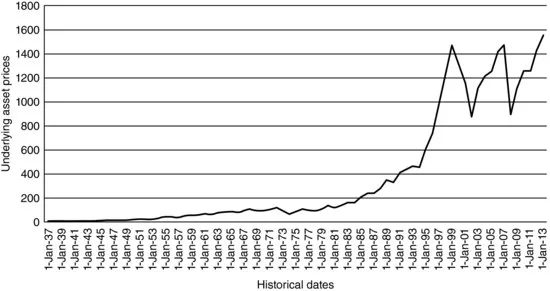
But what about the passive investors, those who judge that the future direction of price movements is unpredictable in all but the long run? Empirically, single equity prices and stock market indices tend to follow a pattern that closely resembles what mathematicians call a random walk (with drift). Predicting future price changes over anything but the medium to long term in such a world is likely to be unfulfilling. Investors can “predict” that they will earn a long-run average return above the risk-free rate (since equities are risky) but the intermediate path will be far from predictable. In this case, a single investor can only systematically “beat the market” by being incredibly lucky. This is the world of the quantitative analyst. Put very simply, quantitative analysts attempt to model the returns from assets, rather than their fair value prices since, empirically, price movements appear random but returns, over time, seem to follow something akin to a normal distribution (Figure 1.1).
More recently, academics have suggested that, in fact, equity prices may more closely resemble a first-order autoregressive process than a random walk. Without wishing to get too mired in mathematical-speak, such a process allows for mean reversion to the trend. If so, then there may be opportunities, after all, for savvy investors to beat the market. They just need to be able to determine the trend!
Neither the random-walk model nor the autoregressive model seems to be an entirely accurate description of the process of equity price determination, however. Stock markets are much more volatile than such models would seem to imply. In particular, they do not seem fully to be able to explain the prevalence of stock market crashes.6 And, the models do not explain why technical analysis has so many fans. If equity prices change with a random walk, then technical analysis is useless. If equity prices follow a first-order autoregressive process, however, then it may be possible to predict price moves from statistical analysis but the “head-and-shoulder” and “double-bottom” formations popular with technical analysts the world over are likely to be little more than colourful nonsense. As Simon Beninga suggests in his book Financial Modeling, “if you are going to be a technician, you have to learn to say these things with a straight face”.
So, why does technical analysis appear to work at some level? Perhaps because it has lots of fans who follow the techniques and take investment decisions based on such. Is this rational, not entirely so but, then, humans are far from rational. How else can one explain the Dot-Com Bubble?
We have described the processes driving actual equity prices in some detail since those same processes are at work in the other asset classes, most especially commodities, foreign exchange and indices. Fixed income products are much less easy to model, however.
1.1.6 The equity risk premium and the pre-FOMC announcement drift
The equity premium is the difference between the “average” return on the stock market and the yield on short-term government bonds. Most academic research into the size of the premium finds that it is too high to compensate for the average riskiness of equities. The equity premium puzzle is the name given to this phenomenon. Mehra (2008) provides a review of the literature on this topic.7
A recent New York Fed staff report suggested that since 1994 more than 80% of the equity premium on US equities was earned during the 24 hours preceding scheduled Federal Open Market Committee (FOMC) announcements (which generally occur...