![]()
1
Introduction
Ian T. Jolliffe and David B. Stephenson
Mathematics Research Institute, University of Exeter
Forecasts are almost always made and used in the belief that having a forecast available is preferable to remaining in complete ignorance about the future event of interest. It is important to test this belief a posteriori by assessing how skilful or valuable was the forecast. This is the topic of forecast verification covered in this book, although, as will be seen, words such as ‘skill’ and ‘value’ have fairly precise meanings and should not be used interchangeably. This introductory chapter begins, in Section 1.1, with a brief history of forecast verification, followed by an indication of current practice. It then discusses the reasons for, and benefits of, verification (Section 1.2). The third section provides a brief review of types of forecasts, and the related question of the target audience for a verification procedure. This leads on to the question of skill or value (Section 1.4), and the chapter concludes, in Section 1.5, with some discussion of practical issues such as data quality.
1.1 A brief history and current practice
Forecasts are made in a wide range of diverse disciplines. Weather and climate forecasting, economic and financial forecasting, sporting events and medical epidemics are some of the most obvious examples. Although much of the book is relevant across disciplines, many of the techniques for verification have been developed in the context of weather, and latterly climate, forecasting. For this reason the current section is restricted to those areas.
1.1.1 History
The paper that is most commonly cited as the starting point for weather forecast verification is Finley (1884). Murphy (1996a) notes that although operational weather forecasting started in the USA and Western Europe in the 1850s, and that questions were soon asked about the quality of the forecasts, no formal attempts at verification seem to have been made before the 1880s. He also notes that a paper by Köppen (1884), in the same year as Finley's paper, addresses the same binary forecast set-up as Finley (see Table 1.1), though in a different context.
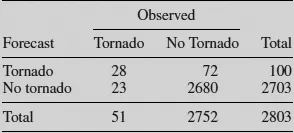
Table 1.1 Finley's tornado forecasts
Finley's paper deals with a fairly simple example, but it nevertheless has a number of subtleties and will be used in this and later chapters to illustrate a number of facets of forecast verification. The data set consists of forecasts of whether or not a tornado will occur. The forecasts were made from 10 March until the end of May 1884, twice daily, for 18 districts of the USA east of the Rockies. Table 1.1 summarizes the results in a table, known as a (2 × 2) contingency table (see Chapter 3). Table 1.1 shows that a total of 2803 forecasts were made, of which 100 forecast ‘Tornado’. On 51 occasions tornados were observed, and on 28 of these ‘Tornado’ was also forecast. Finley's paper initiated a flurry of interest in verification, especially for binary (0–1) forecasts, and resulted in a number of published papers during the following 10 years. This work is reviewed by Murphy (1996a).
Forecast verification was not a very active branch of research in the first half of the twentieth century. A three-part review of verification for short-range weather forecasts by Muller (1944) identified only 55 articles ‘of sufficient importance to warrant summarization’, and only 66 were found in total. Twenty-seven of the 55 appeared before 1913. Due to the advent of numerical weather forecasting, a large expansion of weather forecast products occurred from the 1950s onwards, and this was accompanied by a corresponding research effort into how to evaluate the wider range of forecasts being made.
For the (2 × 2) table of Finley's results, there is a surprisingly large number of ways in which the numbers in the four cells of the table can be combined to give measures of the quality of the forecasts. What they all have in common is that they use the joint probability distribution of the forecast event and observed event. In a landmark paper, Murphy and Winkler (1987) established a general framework for forecast verification based on such joint distributions. Their framework goes well beyond the (2 × 2) table, and encompasses data with more than two categories, discrete and continuous data, and multivariate data. The forecasts can take any of these forms, but can also be in the form of probabilities.
The late Allan Murphy had a major impact on the theory and practice of forecast verification. As well as Murphy and Winkler (1987) and numerous technical contributions, two further general papers of his are worthy of mention here. Murphy (1991a) discusses the complexity and dimensionality of forecast verification, and Murphy (1993) is an essay on what constitutes a ‘good’ forecast.
Weather and climate forecasting is necessarily an international activity. The World Meteorological Organization (WMO) published a 114-page technical report (Stanski et al., 1989) that gave a comprehensive survey of forecast verification methods in use in the late 1980s. Other WMO documentation is noted in the next subsection.
1.1.2 Current practice
The WMO provides a Standard Verification System for Long-Range Forecasts. At the time of writing versions of this are available at a number of websites. The most up-to-date version is likely to be found through the link to the User's Guide on the website of the Lead Centre for the Long Range Forecast Verification System (http://www.bom.gov.au/wmo/lrfvs/users.shtml). The document is very thorough and careful in its definitions of long-range forecasts, verification areas (geographical) and verification data sets. It describes recommended verification strategies and verification scores, and is intended to facilitate the exchange of comparable verification scores between different centres. An earlier version is also available as attachments II-8 and II-9 in the WMO Manual on the Global Data-Processing System (http://www.wmo.int/pages/prog/www/DPS/Manual/WMO485.pdf). Attachment II-7 in the same document discusses methods used in standardized verification of NWP (Numerical Weather Prediction) products. Two further WMO documents can be found at http://www.wmo.int/pages/prog/amp/pwsp/pdf/TD-1023.pdf and http://www.wmo.int/pages/prog/amp/pwsp/pdf/TD-1103.pdf. These are respectively Guidelines (and Supplementary Guidelines) on Performance Assessment of Public Weather Services. The latter is discursive in nature, whilst the guidelines in the former are more technical in nature.
European member states report annually on verification of ECMWF (European Centre for Medium Range Weather Forecasts) forecasts in their national weather services, and guidance on such verification is given in ECMWF Technical Memorandum 430 by Pertti Nurmi (http://www.ecmwf.int/publications/library/ecpublications/_pdf/tm/401-500/tm430.pdf).
At a national level, verification practices vary between different National Services, and most use a range of different verification strategies for different purposes. For example, verification scores used at the time of writing by the National Climate Centre at the Bureau of Meteorology in Australia range through many of the chapters that follow, for example proportion correct (Chapter 3), LEPS scores (Chapter 4), root mean square error (Chapter 5), anomaly correlation (Chapter 6), Brier skill score (Chapter 7) and so on (Robert Fawcett, personal communication).
There is a constant need to adapt practices, as forecasts, data and users all change. An increasing number of variables can be, and are, forecast, and the nature of forecasts is also changing. At one end of the range there is increasing complexity. Ensembles of forecasts, which were largely infeasible 30 years ago, are now commonplace (Chapter 8), and the verification of spatial forecasts has advanced significantly (Chapter 6). At the other extreme, a wider range of users requires targeted, but often simple (at least to express), forecasts. The nature of the data available with which to verify the forecasts is also evolving with increasing use of remote sensing by satellite and radar, for example.
An important part of any operational verification system is to have software to implement the system. As well as the widely available software described in Appendix, national weather services often have their own systems. For example, the Finnish Meteorological Institute has a comprehensive operational verification package, which is regularly updated (Pertti Nurmi, personal communication).
A very useful resource is the webpage of the Joint Working Group on Forecast Verification Research (http://www.cawcr.gov.au/projects/verification/). It gives a good up-to-date overview of verification methods and issues associated with them, together with information on workshops and other events related to verification.
1.2 Reasons for forecast verification and its benefits
There are three main reasons for verification, whose description dates back to Brier and Allen (1951), and which can be described by the headings administrative, scientific and economic. Naturally no classification is perfect and there is overlap between the three categories. A common important theme for all three is that any verification scheme should be informative. It should be chosen to answer the questions of interest and not simply for reasons of convenience.
From an administrative point of view, there is a need to have some numerical measure of how well forecasts are performing. Otherwise, there is no objective way to judge how changes in training, equipment or forecasting models, for example, affect the quality of forecasts. For this purpose, a small number of overall measures of forecast performance are usually desired. As well as measuring improvements over time of the forecasts, the scores produced by the verification system can be used to justify funding for improved training and equipment and for research into better forecasting models. More generally they can guide strategy for future investment of resources in forecasting.
Measures of forecast quality may even be used by administrators to reward forecasters financially. For example, the UK Meteorological Office currently operates a corporate bonus scheme, several elements of which are based on the quality of forecasts. The formula for calculating the bonus payable is complex, and involves meeting or exceeding targets for a wide variety of meteorological variables around the UK and globally. Variables contributing to the scheme range from mean sea level pressure, through precipitation, temperature and several others, to gale warnings.
The scientific viewpoint is concerned more with understanding, and hence improving the forecast system. A detailed assessment of the strengths and weaknesses of a set of forecasts usually requires more than one or two summary scores. A larger investment in more complex verification schemes will be rewarded with a greater appreciation of exactly where the deficiencies in the forecast lie, and with it the possibility of improved understanding of the physical processes that are being forecast. Sometimes there are unsuspected biases in either the forecasting models, or in the forecasters’ interpretations, or both, which only become apparent when more sophisticated verification schemes are used. Identification of such biases can lead to research being targeted to improve knowledge of why they occur. This, in turn, can lead to improved scientific understanding of the underlying processes, to improved models, and eventually to improved forecasts.
The administrative use of forecast verification certainly involves financial considerations, but the third, ‘economic’, use is usually taken to mean something closer to the users of the forecasts. Whilst verification schemes in this case should be kept as simple as possible in terms of communicating their results to users, complexity arises because different users have different interests. Hence there is the need for different verification schemes tailored to each user. For example, seasonal forecasts of summer rainfall may be of interest to both a farmer, and to an insurance company covering risks of event cancellations due to wet weather. However, different aspects of the forecast are relevant to each. The farmer will be interested in total rainfall, and its distribution across the season, whereas the insurance company's concern is mainly restricted to information on the likely number of wet weekends.
As another example, consider a daily forecast of temperature in winter. The actual temperature is relevant to an electricity company, as demand for electricity varies with temperature in a fairly smooth manner. In contrast, a local roads authority is concerned with the value of the temperature relative to some threshold, below which it should treat the roads to prevent ice formation. In both examples, a forecast that is seen as reasonably good by one user may be deemed ‘poor’ by the other. The economic view of forecast verification needs to take into account the economic factors underlying the users’ needs for forecasts when devising a verification scheme. This is sometimes known as ‘customer-based’ or ‘user-oriented’ verification, as it provides information in terms more likely to be understood by the ‘customer’ or ‘user’ than a purely ‘scientific’ approach. Forecast verification using economic value is discussed in detail in Chapter 9. Another aspect of forecasting for specific users is the extent to which users prefer a simple, less informative forecast to one that is more informative (e.g. a probability forecast) but less easy to interpret. Some users may be uncomfortable with probability forecasts, but there is evidence (Harold Brooks, personal communication) that probabilities of severe weather events such as hail or tornados are preferred to crude categorizations such as {Low Risk, Medium Risk, High Risk}. User-oriented verification should attempt to ascertain such preferences for the user or ‘customer’ at hand.
A benefit common to all three classes of verification, if it is informative, is that it gives the administrator, scientist or user concrete information on the quality of forecasts that can be used to make rational decisions.
This section has been written from the viewpoint of verification of forecasts issued by National Meteorological Services. Virtually all the points made are highly relevant for forecasts issued by private companies, and in other subject domains, but it appears that they may not always be appreciated. Although most Nati...