- English
- ePUB (mobile friendly)
- Available on iOS & Android
About this book
Data mining has been defined as the search for useful and previously unknown patterns in large datasets, yet when faced with the task of mining a large dataset, it is not always obvious where to start and how to proceed.
This book introduces a visual methodology for data mining demonstrating the application of methodology along with a sequence of exercises using VisMiner. VisMiner has been developed by the author and provides a powerful visual data mining tool enabling the reader to see the data that they are working on and to visually evaluate the models created from the data.
Key features:
- Presents visual support for all phases of data mining including dataset preparation.
- Provides a comprehensive set of non-trivial datasets and problems with accompanying software.
- Features 3-D visualizations of multi-dimensional datasets.
- Gives support for spatial data analysis with GIS like features.
- Describes data mining algorithms with guidance on when and how to use.
- Accompanied by VisMiner, a visual software tool for data mining, developed specifically to bridge the gap between theory and practice.
Visual Data Mining: The VisMiner Approach is designed as a hands-on work book to introduce the methodologies to students in data mining, advanced statistics, and business intelligence courses. This book provides a set of tutorials, exercises, and case studies that support students in learning data mining processes.
In praise of the VisMiner approach:
"What we discovered among students was that the visualization concepts and tools brought the analysis alive in a way that was broadly understood and could be used to make sound decisions with greater certainty about the outcomes"
—Dr. James V. Hansen, J. Owen Cherrington Professor, Marriott School, Brigham Young University, USA
"Students learn best when they are able to visualize relationships between data and results during the data mining process. VisMiner is easy to learn and yet offers great visualization capabilities throughout the data mining process. My students liked it very much and so did I."
—Dr. Douglas Dean, Assoc. Professor of Information Systems, Marriott School, Brigham Young University, USA
Tools to learn more effectively

Saving Books

Keyword Search

Annotating Text

Listen to it instead
Information
Data Mining Objectives
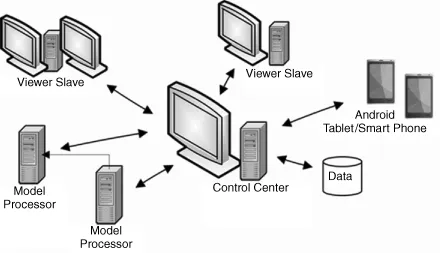
Introduction to VisMiner
- the Control Center, which manages the datasets, starts and stops the modelers and viewers, and coordinates synchronization between viewers
- VisSlave and ModelSlave which establish the connections between a slave computer and the Control Center
- the modelers that execute the sophisticated data mining algorithms
- the viewers that present interactive visualizations of the datasets and the models generated using the datasets.
The Data Mining Process
- Initial data exploration – conduct an initial exploration of the data to gain an overall understanding of its size and characteristics, looking for clues that should be explored in more depth.
- Dataset preparation – prepare the data for analysis.
- Algorithm application – select and apply data mining algorithms to the dataset.
- Results evaluation – evaluate the results of the algorithm applications, assessing the “goodness of fit” of the data to the algorithm results and assessing the nature and strengths of inputs to the algorithm outputs.
Initial Data Exploration
- Dataset size and format – Determine the number of observations in the dataset. How much space does it occupy? In what format is it stored? Possible formats include tab or comma delimited text files, fixed field text files, tables in a relational database, and pages in a spreadsheet. Since most datasets stored in a relational database are encoded in the proprietary format of the database management system used to store the data, check that you have access to software that can retrieve and manipulate the content. Look also at the number of tables containing data of interest. If found in multiple tables, determine how they are linked and how they might be joined.
- Attribute enumeration – Begin by browsing the list of attributes contained in the dataset and the corresponding types of each attribute. Understand what each attribute represents or measures and the units in which it is encoded. Look for identifier or key attributes – those that uniquely identify observations in the dataset.
- Attribute distributions – For numeric types, determine the range of values in the dataset, then look at the shape and symmetry or skew of the distribution. Does it appear to approximate a normal distribution or some other distribution? For nominal (categorical) data, look at the number of unique values (categories) and the proportion of observations belonging to each category. For example, suppose that you have an attribute called CustomerType. The first thing that you want to determine is the number of different CustomerTypes in the dataset and the proportions of each.
- Identification of sub-populations – Look for attribute distributions that are multimodal – that is distributions that have multiple peaks. When you see such distributions, it indicates that the observations in the dataset are drawn from multiple sub-populations with potentially different distributions. It is possible that these sub-populations could generate very different models when submitted in isolation to the data mining algorithms as compared to the model generated when submitting the entire dataset. For example, in some situations the purchasing behavior of risk-taking individuals may be quite different from those that are risk averse.
- Pattern search – Look for potentially interesting and significant relationships (or patterns) between attributes. If your data mining objective is the generation of a prediction model, focus on relationships between your selected output attribute and attributes that may be considered for input. Note the type of the relationship – linear or non-linear, direct or inverse. Ask the question, “Does this relationship seem reasonable?” Also look at relationships between potential input attributes. If they are highly correlated, then you probably want to eliminate all but one as you conduct in-depth analyses.
Dataset Preparation
- Observation reduction – Frequently there is no need to analyze the full dat...
Table of contents
- Cover
- Title Page
- Copyright
- Preface
- Acknowledgments
- Chapter 1: Introduction
- Chapter 2: Initial Data Exploration and Dataset Preparation Using VisMiner
- Chapter 3: Advanced Topics in Initial Exploration and Dataset Preparation Using VisMiner
- Chapter 4: Prediction Algorithms for Data Mining
- Chapter 5: Classification Models in VisMiner
- Chapter 6: Regression Analysis
- Chapter 7: Cluster Analysis
- Appendix A: VisMiner Reference by Task
- Appendix B: VisMiner Task/Tool Matrix
- Appendix C: IP Address Look-up
- Index
Frequently asked questions
- Essential is ideal for learners and professionals who enjoy exploring a wide range of subjects. Access the Essential Library with 800,000+ trusted titles and best-sellers across business, personal growth, and the humanities. Includes unlimited reading time and Standard Read Aloud voice.
- Complete: Perfect for advanced learners and researchers needing full, unrestricted access. Unlock 1.4M+ books across hundreds of subjects, including academic and specialized titles. The Complete Plan also includes advanced features like Premium Read Aloud and Research Assistant.
Please note we cannot support devices running on iOS 13 and Android 7 or earlier. Learn more about using the app