![]()
1
Introduction
1.1 Atomic Optical Emission Spectrochemistry (OES)
1.1.1 Conventional OES
Since the early 1800s, scientists realized that elements emitted specific colors of light. As atomic theory developed, spectroscopists learned that those colors, wavelengths, or frequencies were a unique signature for each atom and ion. Hence spectra became the fingerprints of the emitting atomic species. This is the basis for atomic spectrochemical analysis.
Early sources of spectra were the sun, flames, and gas discharges, such as the old Geissler tube. These were plasma sources, with varying degrees of ionization depending on the source conditions. Against the 5000 K photosphere of the sun, we see the Fraunhofer absorption lines due to neutral and once ionized species. In the solar corona, highly ionized spectra are observed because of plasma temperatures that reach into the hundreds of thousands of degrees.
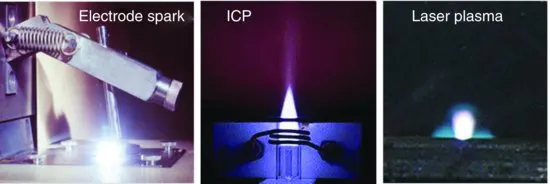
Many sources have been developed for spectrochemistry, but two workhorses have been the conventional electrode spark and, more recently, the inductively coupled plasma (ICP). These are illustrated in Figure 1.1, which also contains a photograph of the laser spark. The electrode spark has excitation temperatures of up to 50 000 K, while the argon ICP temperature is more typically about 10 000 K. Usually these sources are used for laboratory analyses, but occasionally they are pressed into service for situations requiring more rapid data acquisition. For example, the conventional spark has been used for decades to monitor the steel-making process by withdrawing a molten sample that is then solidified and transported to a laboratory located in the plant for rapid analysis. Decisions on additives are made based on the resulting spectroscopic data.
1.1.2 Laser OES
As soon as the laser was developed in the early 1960s, spectrochemists began investigating its potential uses (Radziemski, 2002). An early observation was that a pulsed laser could produce a small plasma in air and on metals (Figure 1.1). The emission from that plasma showed the potential for spectrochemical analysis. However, from 1960 to 1980, the analytical capability was inferior to that of the conventional spark and laser technology was in its infancy, so the technique was less favored than a related one—laser ablation into a conventional plasma source. Here the laser was used to vaporize a small amount of sample for analysis by, for example, the conventional electrode spark (Moenke and Moenke-Blankenburg, 1973). However, that was not the only way the laser could be used in spectrochemistry.
The development of tunable dye lasers meant that one could illuminate a prepared source of atoms with radiation resonant with a transition in one of the atomic species. Then either the absorption of the laser beam or the laser-induced fluorescence could be used as an analytical signal. These techniques discriminated against the background and increased the signal to noise considerably by recycling the same atoms many times. Sometimes the atoms were placed in the laser cavity itself. The intracavity absorption technique was a very sensitive spectrochemical method, if difficult to employ generally.
Both absorption and fluorescence are used in many applications. However, because the laser must be tuned to a specific transition in a specific species, it is not as broadly useful as a hot plasma in which a variety of species can be excited and monitored simultaneously.
1.2 Laser-Induced Breakdown Spectroscopy (LIBS)
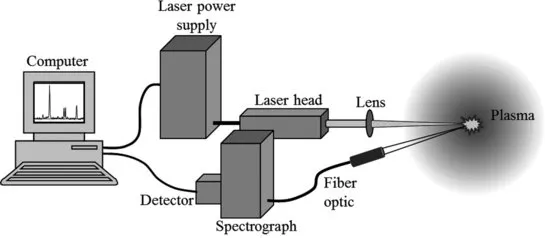
Laser-induced breakdown spectroscopy (LIBS), also sometimes called laser-induced plasma spectroscopy (LIPS) or laser spark spectroscopy (LSS) has developed rapidly as an analytical technique over the past three decades. As most commonly used and shown schematically in Figure 1.2, the technique employs a low-energy pulsed laser (typically tens to hundreds of mJ per pulse) and a focusing lens to generate a plasma that vaporizes a small amount of a sample. A portion of the plasma light is collected and often directed to a spectrometer by a fiber optic. The spectrometer disperses the light emitted by excited atoms, ions, and simple molecules in the plasma, a detector records the emission signals, and electronics take over to digitize and display the results. The book cover shows a LIBS spectrum with certain strong spectral features standing out from the continuous background plasma light.
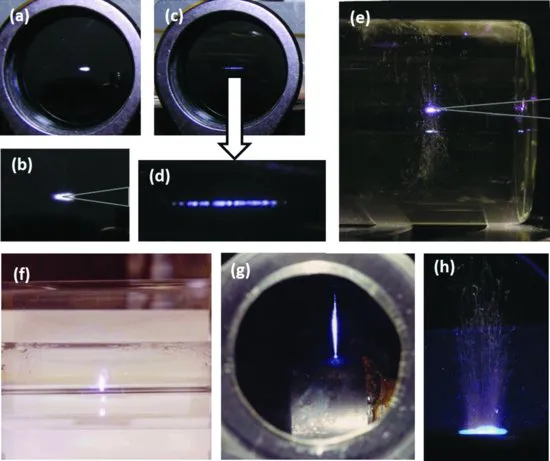
LIBS is an appealing technique compared to many other types of elemental analysis, because setting up an apparatus to perform a LIBS measurement is very simple. One merely focuses a laser pulse in or on a sample, which can be a gas, liquid, aerosol, or solid, to form a microplasma, examples of which are shown in Figure 1.3.
The spectra emitted are used to determine the sample's elemental constituents. However, the basic physical and chemical processes involved are not so simple. The initiation, formation and decay of the laser plasma are complex processes. Absorption of the incident laser radiation occurs through the mechanism of inverse bremsstrahlung, involving three body collisions between photons, electrons, and atoms or molecules. In gases and liquids, the plasma creates a shock wave in the surrounding medium transferring energy by means of conduction, radiation, and the shock wave. When the experiment deals with a sample surface in a vacuum, the plasma and ejecta expand freely away from the surface at different speeds. Excitation of specific energy levels in different atoms is likewise complex, and depends on factors such as thermodynamic equilibrium and interactions with other atoms and molecules generally lumped under the category of matrix effects. After the laser pulse has terminated, the plasma decays over an interval of one to several microseconds, depending on the laser energy deposited. In vacuum, that temporal process is shortened. Most LIBS experiments involve repetitive plasmas at frequencies of 10 Hz or greater.
The spectra observed change as the plasma evolves temporally as shown in Figure 1.4. Soon after plasma initiation, continuum and ionic spectra are seen. The continuum is the “white light” from the plasma that contains little spectroscopic information and the ions result from electrons ejected by neutral atoms. As the plasma decays, these are followed by spectra from neutral atoms, and eventually simple molecules formed from the recombination of atoms. Throughout the temporal history, one observes a diminishing continuum spectral background due to recombination of free electrons with ions. Inspection of the LIBS spectrum reveals immediate qualitative information about sample com...