![]()
Chapter 1
Introduction
Confucius said ‘I hear and I forget. I see and I remember. I do and I understand’. This proverb sums up the spirit of this book as it is very practical and it involves the reader. Every chapter contains examples and exercises that will capture the reader and ensure the information is passed on in a memorable way.
This book is aimed at numerical professionals, students or academics who wish to learn and apply statistical techniques for problem solving, process improvement or data analysis without getting bogged down in theory. In fact anyone that wants to be data driven in their decision making should use this book to understand how to use Minitab.
The vehicle for the statistical techniques is Minitab version 16. However, most of it will also be applicable to version 15. The notes will indicate if a feature is in Minitab 16 only by stating ‘M16 only’. At this point I could give you a list of the new features that are incorporated within Minitab 16 but that would be a bit pointless, so I will attempt to point out the important new features as we go through the modules. You will definitely need to have access to a copy of Minitab when going through the book and it would be advantageous to have a copy of Microsoft Excel as well.
Minitab has developed considerably between versions 15 and 16. One of the main enhancements is the Assistant which helps users select the appropriate test, enter the data and interpret the results. The Assistant is available for a number of the key test procedures. Users of older versions of Minitab and also Minitab 16 have the option of using the non-Assistant methods which are accessed via the traditional drop down menus. For convenience, within the book I will refer to this method as the Classic method.
I am a chartered Chemical Engineer and Six Sigma Black Belt. I have worked in the nuclear industry, cosmetics industry and in construction products manufacturing. My main role has always been process improvement and the projects that I have completed have won awards and saved millions of pounds. Whilst honing my problem solving and data analysis skills I recognised that there was a huge gap in the availability of appropriate training materials and yet there was a huge demand from numerical professionals to learn the skills. I was disappointed not to be able to find the right sort of books to help me learn and understand how to use Minitab. However, I was fortunate enough to have my employers put me through my Six Sigma training.
My aim is not to blind the reader with mathematical theory but to teach problem solving and data analysis through the use of statistical analysis in a very graphical and accessible way. The book uses example based learning that each reader can work through at their own pace. Each example is broken down into the very exact steps that must be followed in order to work through the complex analysis. After the examples there is usually an exercise so that the reader can be assured that they have understood the key learning points. However, even the answers do not leave the reader cold with just a single numerical solution. The exercise answers show graphic milestones that the reader must achieve in order to reach the endpoint of the analysis. The example and exercise data sets can be downloaded from the Wiley publishing website, www.wiley.com/go/six_sigma_methodology.
I have found that other books teaching this subject make themselves inaccessible to beginners either because complex statistical theory is put before practical learning or there is an attempt to cover everything that Minitab can do. The main strengths of this book are that it is a training course in book form and it teaches a much sought after skill set. It teaches the reader using a logical and stepwise methodology. The examples and exercises take the reader through key learning points and, because they are so very easy to follow, they build the reader's confidence. The book does not cover every possible topic. For instance it does not cover the handling of attribute data. This is due to space limitations and the fact that in a numerical world we come across this type of data set less and less. However, if there are procedures that you wish to learn with attribute data I suggest that you learn the equivalent test for continuous data and then use the help system to understand how to handle attribute data. Also, we will not be learning Six Sigma project methodology as it would probably double the page count.
I would like to introduce a metaphor for problem solving. I am standing in Field A but when I solve my problem I will be able to move over to Field B which is a better place. In between is a rather large wall, and this wall represents the problem. The wall has a gate and when I find the key, which can be represented by the answer, I can open the gate and step through. The problem is that I need to find the key and it can be anywhere in Field A. However, to help me find the key I have a metal detector. The thing that determines how well I use the metal detector is my own skill. Well, in the real world the metal detector is Minitab and to find the solution to numerical problems I must ensure that I can utilise this fantastic tool. This book's sole purpose is to increase your skill level with Minitab. The intention is to do this by giving you a bit of theory and then getting you to solve problems using Minitab. Luckily, Minitab will make our life easy by doing all the complicated maths. All we need to do is tell it what to do and then understand what it is telling us.
Let's have a look at what we are going to be learning throughout this book. If you are beginner then I strongly recommend that you start from the very beginning and at least go through Chapters 2– 4 before you start skipping forward to topics of interest. If you are an experienced user of Minitab then feel free to launch into any of the topics that are of interest to you.
1. IntroductionThis is the wordiest chapter in the book and you're doing well to get through it. In the rest of the book we are going to keep you busy in front of your computer working on Minitab.
2. Minitab NavigationIn this chapter you are going to get the feel of Minitab. We will start by discussing the Minitab windows and then the drop down menus. As discussion is not a very good way of learning we will then import some data and look at the data formatting system used within Minitab. For additional learning we will put together some simple graphs and we will learn to add additional content to those graphs. This has a twofold purpose in that the reader will experience some of the stand alone graphing tools and will become familiar with Minitab navigation. Later you will see that a lot of Minitab's statistical procedures produce their own graphs which are very useful for data analysis. We also need to learn how to use the report pad so that we can send reports to Microsoft Word and PowerPoint.
3. Basic StatisticsThis is the chapter where we learn the basic background statistics that we need to know to help us understand what is coming up in the more demanding chapters. If you are new to statistical methods you have probably only been introduced to descriptive statistics. In this chapter we learn one of the most important concepts in the course and that is the difference between descriptive statistics and inferential statistics and how that links to the concept of the entire population and a sample set from that population.
4. Hypothesis TestingYou could say that hypothesis testing is one of the foundational chapters of the statistical procedures that we are going to be using. Once we get to grips with the theory we will start using some of the test procedures within Minitab. We will start by looking at a single set of data and determining whether the mean of the population could be a particular value. We will then compare two data sets and attempt to infer conclusions about them.
5. Analysis of VarianceThe analysis of variance (ANOVA) procedure builds on the last chapter and lets us make comparisons between two or more groups. We start by looking at the one way ANOVA procedure and move onto the ANOVA General Linear Model (GLM). The GLM allows us to model multiple factors and multiple levels.
6. Measurement System AnalysisThis chapter teaches us procedures to help us understand whether our measurement systems are adequate and reliable. The measurement system can be an instrument, like a weigh scale, or it could be a person making a judgment about a product or process. Either way we want to know if the measurement systems are free from human failings and whether they can be relied upon.
7. Statistical Process ControlStatistical process control (SPC) is about monitoring your process and looking for unusual occurrences by using control charts. Finding out the type of unusual behaviour and when it occurs helps us to identify the initiating events. We can then put controls in place that will eliminate the initiating events and thereby making the process more stable.
8. Process CapabilityWe use process capability to measure our customer requirements against what the process is actually delivering. This is often done at the start of the project to measure the gaps and then again at the end of the project to demonstrate the improvement.
9. Correlation and RegressionThese two terms are often confused. In the world of Minitab correlation is about establishing whether two parameters have a linear relationship and checking the strength of that relationship. Regression goes further by trying to fit an equation to model the relationship. We will learn procedures for single and multiple factor regression.
10. Design of ExperimentDon't worry. Design of experiment (DOE) is not always about being in a laboratory and conducting experiments. DOE is actually an optimised methodology for checking selected inputs and checking whether they have a statistically significant effect on a selected response. DOE tells us how strongly each factor is affecting the response and whether any of the interactions are important to the response.
There are many types of DOE and we will concentrate on two of the more commonly used types. DOE comes with its own terminology so we will spend a bit of time getting to grips with the terminology before we get into DOE proper.
11. HelpMinitab has a number of comprehensive help systems that can help you should you get stuck. This chapter will introduce the help systems and show you what is available so you will be able to quickly get the information that you need.
This book originally started out as a course that I ran within British Gypsum. I then decided that I could do with less time with my wife and family and it would be a good idea to convert the course into a book. One of the concepts that I introduced during the course was the Statistical Charter. The charter was a self imposed set of rules designed to protect the stakeholders, customers and no doubt our own reputations. The charter has the following functions:
- Stops us from turning fiction into fact.
- Warns stakeholders regarding the certainty of our conclusions.
- Sets limits so that we can safely execute the statistical procedures.
You will see that the charter manifests itself within the care that we take to set up the test procedures. I can give you guidance that, for example, we should try and aim for a power of between 80–90% but when it comes to using the tests within the real world you may choose to ignore the advice. However, most of the advice given here is derived from the Minitab White Papers and gives a robust methodology for conducting the procedures.
Statistics can have a bad reputation. It was Benjamin Disraeli who said ‘There are lies, damn lies and statistics’ and we don't want to perpetuate that reputation. Personally, I think a particular quote from the Toby McGuire Spiderman movie is more apt for the exponents of statistical analysis: ‘With great power comes great responsibility’.
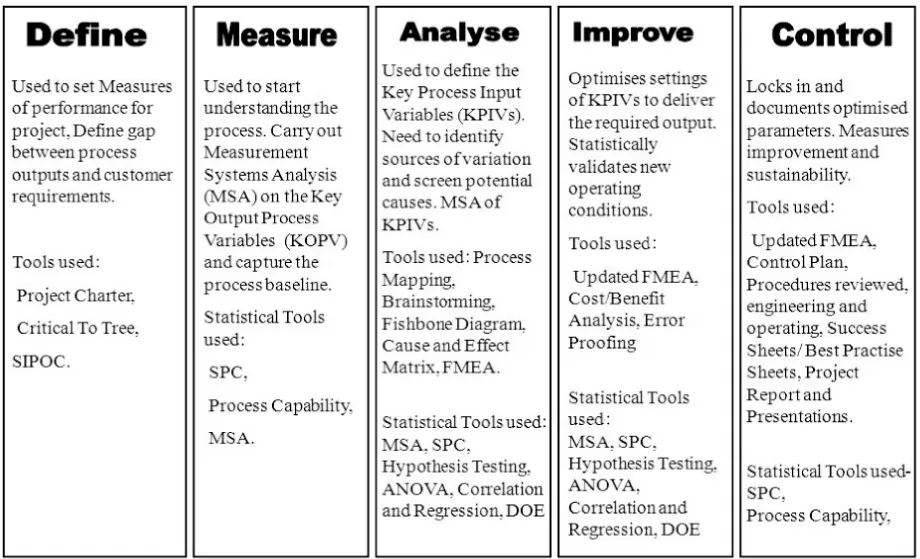
The statistical techniques taught within this book are most commonly found within Six Sigma. They are used for problem solving, data analysis and the reduction of variation within the DMAIC Framework. There are other business improvement frameworks such as World Class Manufacturing (WCM) and these tools and techniques sit equally well within the Focussed Improvement (FI) Pillar of WCM. However, the use of Six Sigma is far more widespread and it is more commonly associated with Process Improvement and Minitab.
The table below shows how the statistical toolset can be used within the DMAIC Framework. The tools used are not set in stone as the methodology allows the use of any tool which gets the job done.
For each of the chapters I would strongly recommend that you initially read the theory section in the chapter and then, when it comes to examples in the book, follow the instructions to work through each example on a PC with a copy of Minitab. When you are happy that you understand the methodology applied to solve the example problems then try a single exercise without using the book. After completing the exercise go back and review the solution shown within the book. If you are happy that you have successfully completed the exercise then complete all the remaining exercises in the same way. If not, review the notes and the solution to establish where you went wrong and then repeat the exercise. As a gift to the reader for reading this far into the introduction I will tell you that the exercises are usually easier than the examples.
In case you are wondering, all of the data sets used are fictitious. They were designed to show particular aspects of the methodology being taught.
And finally, if you are in need of some inspiration go onto YouTube and search for the ‘Minitab song’, it keeps me motivated!
![]()
Chapter 2
Minitab Navigation
2.1 Windows
In this Module we want you to get the feel of Minitab. We are going to do this by first discussing the Minitab windows and then the dropdown menus. As discussion is not a very good way of learning we will then import some data and get you to start working with that data.
1. Open Minitab.
You will be presented with the screen below.
At the top of the screen there are the dropdown menus and toolbars, which work like most Microsoft applications. Below that we have two windows: the session window and the project window. The graphs windo...