![]()
PART 1
HEALTH STATUS ACROSS THE LIFE SPAN
![]()
CHAPTER 1
AFRICAN AMERICAN HEALTH: AN OVERVIEW
RONALD L. BRAITHWAITE SANDRA E. TAYLOR HENRIE M. TREADWELL
In 1980, in response to arguments that the commonly used Gross Domestic Product, a measure of human progress, failed to adequately measure well-being, Mahbub ul Haq, a Pakistani economist, devised the concept for the human development index (Burd-Sharps, Lewis, & Martins, 2008). With the assistance of Nobel laureate Amartya Sen and other economists from Yale University and the London School of Economics, Dr. Haq developed the Human Development Index (HDI). The HDI’s success in expanding both the measure and discussion of well-being beyond the confines of income has made it one of the most widely used indices of both global and national well-being. Since its creation in 1990, the HDI has been used by the United Nations Development Program (UNDP) as a means of determining a country’s developmental status—developed, developing, or underdeveloped. A country’s HDI score and its corresponding developmental status is assessed and reported annually by the UNDP.
The HDI score is computed using variables considered to be standard measures of “human development.” The variables are life expectancy at birth, used as an index of population health and longevity; knowledge and education, measured by adult literacy and primary, secondary, and tertiary school enrollment; and standard of living, measured by the Gross National Product per capita at purchasing power parity in U.S. dollars (Burd-Sharps et al., 2008; Sotelo & Gimeno, 2003). The HDI variables are used to generate scale scores between zero and one. The resulting HDI scale score range is divided into three categories—high (≥ 0.80), medium (0.50-0.79), and low (≤ 0.50)—where zero indicates the lowest level of human development and one (1), the highest level of human development (Burd-Sharps et al., 2008). Countries, such as the United States, that have high HDI scores are considered to be developed, and those with medium or low HDI scores are considered to be developing or underdeveloped (third world), respectively.
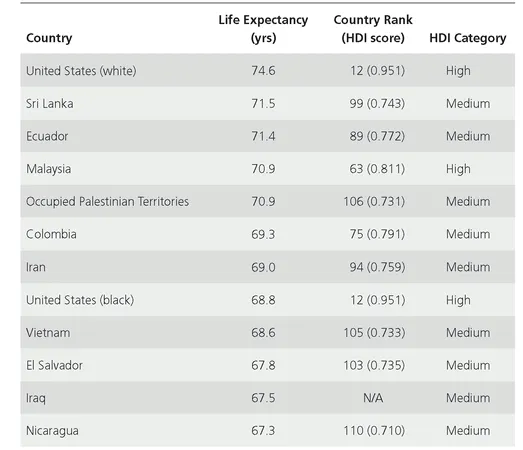
The HDI is a means by which the United States and other countries assess their global competitiveness, the well-being of their communities, and societal disadvantages (Burd-Sharps et al., 2008). A recent comparison of federal health data from 2005 with those from 2006, using the HDI, revealed a persistently poor international health status for U.S. black males. Despite living in the richest and most medically advanced country in the world, U.S. blacks have a health status comparable to those residing in “medium human development” countries (Gadson, 2006). In 1990, the New England Journal of Medicine estimated the life expectancy of U.S. black males to be sixty-five years. In the sixteen years following the 1990 estimate, black male life expectancy rates showed marginal improvement in 2005-6 (68.8 years). In an international life expectancy comparison, the life expectancy at birth for U.S. black males (68.8 years) was less than it was for males in Iran (69.0 years), Colombia (69.3 years), Occupied Palestinian Territories (70.9 years), Ecuador (71.4 years), and Sri Lanka (71.5 years) (see Table 1.1). With a difference of nearly six years from U.S. white males, the life expectancy of U.S. black males is more comparable to the life expectancies of males in Vietnam (68.6 years), El Salvador (67.8 years), and Iraq (67.5 years) than it is to their U.S. white male counterparts (74.6 years) (Gadson, 2006).
In the United States, Northeastern states—such as Connecticut, Massachusetts, New Jersey, Washington, D.C., and Maryland, which have the highest earning potential, education attainment and enrollment, and the second-highest life expectancy of the four U.S. Census regions—have the highest HDI (Burd-Sharps et al., 2008). States such as Mississippi, West Virginia, Louisiana, Arkansas, and Alabama, which are in the Southern region, have the lowest HDI in that the people in this region have, on average, the shortest life expectancy, lower earning potential, and lower levels of educational attainment and enrollment than do Americans in other parts of the country. In general, women have higher educational attainment and a life expectancy five years greater than men; however, the advantages of education and health are overshadowed by women’s lower earnings, thus giving men a slightly higher HDI.
Racially and ethnically, Asians outperform all other racial groups in all three human development dimensions. Of all the racial and ethnic groups, Asians have the highest earnings, which are slightly greater than whites, whose HDI ranking too is second to Asians. Asians also rank first and vastly higher than whites in health and educational advantages. Latinos rank third overall. Despite having the lowest educational and income rankings, the overall good health of Latinos gives them an HDI ranking higher than that of blacks. Even though blacks are third in income and education, their poor health status gives them the bottom ranking. The health ranking of blacks has resulted in life expectancies five years less than those of Native Americans, who have the second-lowest health ranking, and thirteen years less than Asians, who have the highest health ranking.
TABLE 1.1 Selected Male Life Expectancies at Birth.
Source: U.S. data from National Center for Health Statistics. (2006). Health, United States, 2006, with Chartbook on Trends in the Health of Americans. Hyattsville, MD: Author. International data from United Nations Development Program. (2005). Human development report 2005: International cooperation at a crossroads—Aid, trade and security in an unequal world. New York: Hoechstetter Printing; United Nations Development Program. (2007). Human development report 2007/2008: Fighting climate change—Human solidarity in a divided world. New York: Palgrave Macmillan.
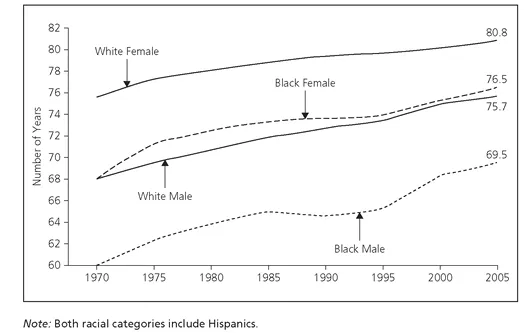
For the past one hundred years, the U.S. black male has had the shortest life expectancy of any other U.S. racial or ethnic group (Gadson, 2006). Although life expectancy has increased steadily since 1970 for whites and blacks, between 1970 and 2005 the increases in life years have been greater for whites than blacks and for women than men (see Figure 1.1) (U.S. Department of Health and Human Services ... , 2008).
FIGURE 1.1 Life Expectancy at Birth, by Race and Sex, 1970-2005.
Source: Centers for Disease Control and Prevention; National Center for Health Statistics, as referenced in Gadson, 2006.
Between 1970 and 2005 the life expectancy for white females remained the highest in the nation. As reflected in the figure, a white female born in 2005 could expect to live approximately 80.8 years, whereas a black female born in the same year could expect to live an average of only 76.5 years, a difference of 4.3 years. With a difference of 6.2 years, a white male born in 2005 could expect to live 75.7 years, compared to a black male born in the same year with a life expectancy of 69.5 years. In the United States, the black male, from birth to eighty-four years, has the highest mortality rates across all ages and geographic regions, with the greatest racial differences in mortality rates reported for males twenty-five to fifty-four years of age (Gadson, 2006).
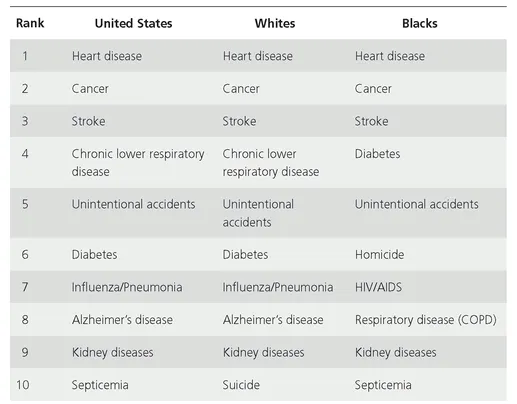
In 2005, blacks, with 1,016.5 deaths per 100,000 persons, had a higher overall age-adjusted mortality rate than whites, at 785.3 deaths per 100,000; Native Americans/ Alaska Natives, at 663.4; and Asians/Pacific Islanders, at 440.2 (Kung, Hoyert, Xu, & Murphy, 2008). High rates of U.S. black male mortality are attributed to the racial health disparities that exist for nearly all major chronic diseases. According to the 2000 census, 36.4 million persons, or 12.9 percent of the U.S. population, identified as black or African American (McKinnon, 2001; Centers for Disease Control and Prevention [CDC], 2005). Of those identifying as black or African American, 35.4 million identified as non-Hispanic. This category, non-Hispanic blacks, has a disproportionately greater burden of disease, injury, death, and disability for many health conditions (CDC, 2005). Although blacks and whites share the top three causes of death and, without regard to ranking, seven of the ten leading causes of death (reflected in Table 1.2), the risk, incidence, morbidity, and mortality rates of disease and injury are often greater for blacks than whites.
TABLE 1.2 Ten Leading Causes of Death (Both Sexes, All Ages).
Source: CDC. (2005, March). National Vital Statistics Report, 53(17); National Center for Health Statistics. (2005, March 7). National Vital Statistics Reports.
HEART DISEASE
Excluding the year 1918, heart-disease-related illnesses have been the leading cause of death in the United States since 1900, killing one American every 34 seconds, or more than twenty-five hundred people daily (American Heart Association, 2005). Heart disease, which is defined as any disorder that prevents the heart from functioning properly, is a general term used to denote various diseases that could affect the heart (U.S. Department of Health and Human Services ... , 2008). The eight types of heart disease are (1) coronary, a blockage of a coronary artery, which can cause chest pain and heart attack; (2) cardiomyopathy, a disease of the heart muscle, which can cause arrhythmia and/or sudden cardiac death; (3) cardiovascular, any number of specific diseases that affect the heart and/or the blood vessel system leading to and from the heart; (4) ischemic, a disease of the heart characterized by a reduction in blood to organs; (5) congestive heart failure and congestive cardiac failure, diseases resulting from any structural or functional cardiac disorder that impairs the heart’s ability to fill with or pump sufficient amounts of blood throughout the body; (6) hypertensive, a disease caused by high blood pressure; (7) inflammatory, a disease involving the inflammation of the heart muscle and/or the surrounding tissue; and (8) valvular, a disease process involving one or more valves of the heart.
With risk factors including obesity, lack of physical activity, smoking, high cholesterol, hypertension, and old age, coronary heart disease is the most common form of heart disease and is the single leading cause of death in America (U.S. Department of Health and Human Services ... , 2008; American Heart Association, 2005). Heart disease deaths represent nearly 60 percent of the total mortality rate, claiming nearly as many lives annually as the next five leading causes of death combined: cancer, chronic lower respiratory disease, accidents, diabetes mellitus, and influenza and pneumonia. In 2004, coronary heart disease death rates per 100,000 persons were higher for males than females and higher for blacks than whites. Overall, coronary heart disease mortality rates were higher for black males (223.9 per 100,000) than they were for white males (194.2), black women (148.7), or white women (114.7). In 2007, a total of 16 million persons, 8.7 million males and 7.3 million females, were estimated to have a history of heart attack and/or angina pectoris, which are both caused by coronary heart disease. Despite blacks having higher heart disease mortality rates, the prevalence of heart disease and heart-disease-related conditions is higher among whites than blacks. Affecting 12.2 percent of the white population, heart disease in whites is second in prevalence only to Native Americans/Alaska Natives.
CANCER
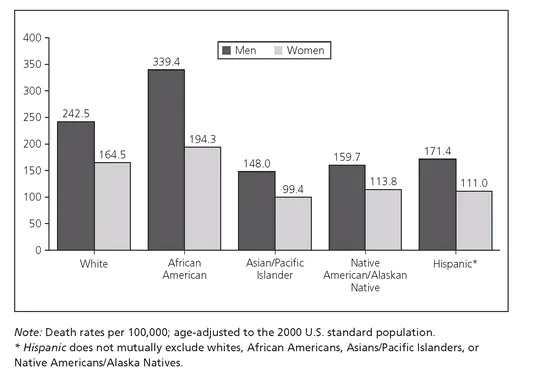
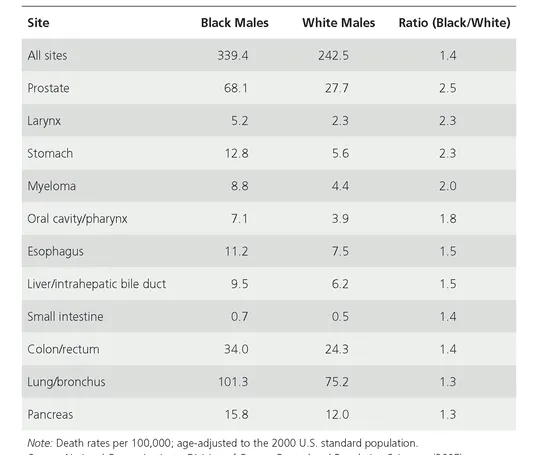
Cancer is the second leading cause of death in the United States, where black men have the highest cancer death rate per 100,000 persons (see Figure 1.2). The cancer death rates are substantially greater among blacks than whites and among men than women. Cancer incidence among men is highest among blacks (607.3 per 100,000 persons), followed by whites (527.2), Hispanics (415.5), and Asians/Pacific Islanders (325.8). Among the U.S. male population, lung cancer, representing 70.3 percent of all cancer deaths; prostate cancer, representing 25.4 percent; colorectal cancer, 21.6 percent; and liver cancer, 15.1 percent are the top four leading causes of cancer deaths (CDC, 2007). With the exception of Hispanics, lung cancer is the leading cause of cancer death among all male racial groups; however, black males, with a lung cancer death rate of 101.3 per 100,000 persons, are 1.3 times more likely to die from lung cancer than are their white counterparts, with a death rate of 75.2 (see Table 1.3) (Ries et al., 2005). Although prostate cancer is the second leading cause of cancer death for all U.S. males with the exception of Asians/Pacific Islanders, blacks are disproportionately impacted (CDC, 2007). As shown in Table 1.3, cancer-related mortalities were 1.3 to 2.3 times greater for black males than white males for other cancers, such as of the larynx, stomach, mouth, esophagus, small intestine, and pancreas, and myeloma.
FIGURE 1.2 Cancer Death Rates, by Race and Ethnicity, United States, 1998-2002.
Source: National Cancer Institute, Division of Cancer Control and Population Sciences. (2005). Surveillance, Epidemiology, and End Results Program, 1975-2002.
Representing 56.1 percent, the percentage of black male cancer deaths attributed to prostate cancer is 2.4 times that of white males (23.4%), 2.9 times that of Hispanic males (19.3%), and 3.4 times that of Native Americans/Alaska Natives (16.5%). As the third leading cause of cancer death for all male racial groups, colorectal cancer death is 1.4 times greater among black males (9.5 deaths per 100,000) than for white males (6.2) (see Table 1.3) (Ries et al., 2005). Liver cancer, although the second leading cause of cancer death among male Asians/Pacific Islanders, is the fourth leading cause of cancer death among men overall (CDC, 2007). The rate of cancer death among black males (9.5 deaths) is 1.5 times greater than that of white males (6.2).
Overall, within the U.S. female population, white women (405.9 per 100,000 persons) have the highest incidence of cancer, followed by black women (379.7), Hispanic women (318.6), Asian/Pacific Islander women (267.4), and Native American/Alaska Native women (242.2) (CDC, 2008a). However, black women presented higher prevalence than white women for colorectal (54.0 vs. 43.3), pancreatic (13.0 vs. 8.9), and stomach (9.0 vs. 4.5) cancers. Breast, lung, and colorectal cancers are the most common cancers among women as well as the leading causes of cancer-related deaths among women. Although breast cancer is the most common form of cancer among women of all races (117.7 per 100,000 persons), it is the second leading cause of cancer deaths for women (24.4 deaths per 100,000). Breast cancer is the first leading cause of death among Hispanic women (15.7) and the second leading cause of death among blacks (32.3), whites (23.8) and Native Americans/Alaska Natives (15.0).
TABLE 1.3 Cancer Sites in Which African American Death Rates Exceed White Death Rates for Men, United States, 1998-2002.
Source: National Cancer Institute, Division of Cancer Control and Population Sciences. (2005). Surveillance, Epidemiology, and End Results Program, 1975-2002.
Despite being the second most common cancer among U.S. women (54.2 per 100,000 persons), lung cancer is the leading cause of female cancer deaths (40.9 deaths) (CDC, 2007). Lung cancer is the primary cause of cancer death among white (41.9), black (40.0), Native American/Alaska Native (30.2), and Asian/Pacific Islander women (18.1) and the second leading cause of death for Hispanic women (14.4). Colorectal cancer is the third most prevalent (42.7) as well as the third leading cause of cancer death (15.2 deaths) among U.S. women. Colorectal cancer is the second most common form of cancer among black (50.6), Hispanic (34.2), and Asian/Pacific Islander (32.1) women and the third most common form of cancer among white (41.6) and Native American/Alaska Native (28.7) women.
STROKE
Claiming over 160,000...