
- English
- ePUB (mobile friendly)
- Available on iOS & Android
eBook - ePub
The Excel Analyst's Guide to Access
About this book
The ultimate handbook for Excel analysts who need reporting solutions using Access
Excel and Access are intended to work together. This book offers a comprehensive review of the extensive analytical and reporting functionality that Access provides and how it enhances Excel reporting functions.
Sales managers, operations analysts, administrative assistants, office managers, and many others who rely heavily on data can benefit from learning to integrate Excel and Access, and this book shows you how.
Coverage includes:
- Data Analysis in Access & the Basics of Access
- Beyond Select Queries
- Transforming Your Data with Access
- Working with Calculations and Dates
- Performing Conditional Analysis
- Adding Dimension with Subqueries and Domain Aggregate Functions
- Running Descriptive Statistics in Access
- Scheduling and Running Batch Analysis
- Leveraging VBA to Enhance Data Analysis
- Reports, Dashboards, and Visualization in Access
- Presenting Data with Access Reports
- Using Pivot Tables and Pivot Charts in Access
- Enhancing Queries and Reports with Visualizations
- Advanced Excel and Access Integration Techniques
- Getting Access Data into Excel
- Using VBA to Move Data between Excel and Access
- Exploring Excel and Access Automation
- Integrating Excel and Access with XML
- Integrating Excel and Other Office Applications
- Access VBA Fundamentals
- Understanding and Using SQL
- and more!
The Excel Analyst's Guide to Access helps you get more from both applications.
Note: CD-ROM/DVD and other supplementary materials are not included as part of eBook file.
Tools to learn more effectively

Saving Books

Keyword Search

Annotating Text

Listen to it instead
Information
Part I
Fundamentals of Data Analysis in Access
In this Part
Chapter 1: The Case for Data Analysis in Access
Chapter 2: Access Basics
Chapter 3: Beyond Select Queries
Chapter 1
The Case for Data Analysis in Access
When you ask most people which software tool they use for their daily data analysis, the answer you most often get is Excel. Indeed, if you were to enter the key words data analysis in an Amazon.com search, you would get a plethora of books on how to analyze your data with Excel. Well if so many people seem to agree that using Excel to analyze data is the way to go, why bother using Access for data analysis? The honest answer: to avoid the limitations and issues that plague Excel.
This is not meant to disparage Excel. Many people across varying industries have used Excel for years, considering it the tool of choice for performing and presenting data analysis. Anyone who does not understand Excel in today's business world is undoubtedly hiding that shameful fact. The interactive, impromptu analysis that Excel can perform makes it truly unique in the industry.
However, Excel is not without its limitations, as you will see in the following section.
Where Data Analysis with Excel Can Go Wrong
Years of consulting experience have brought me face to face with managers, accountants, and analysts who all have had to accept one simple fact: Their analytical needs had outgrown Excel. They all met with fundamental issues that stemmed from one or more of Excel's three problem areas: scalability, transparency of analytical processes, and separation of data and presentation.
Scalability
Scalability is the ability of an application to develop flexibly to meet growth and complexity requirements. In the context of this chapter, scalability refers to Excel's ability to handle ever-increasing volumes of data. Most Excel aficionados will be quick to point out that as of Excel 2007, you can place 1,048,576 rows of data into a single Excel worksheet. This is an overwhelming increase from the limitation of 65,536 rows imposed by previous versions of Excel. However, this increase in capacity does not solve all of the scalability issues that inundate Excel.
Imagine that you are working in a small company and you are using Excel to analyze your daily transactions. As time goes on, you build a robust process complete with all the formulas, pivot tables, and macros you need to analyze the data stored in your neatly maintained worksheet.
As your data grows, you will first notice performance issues. Your spreadsheet will become slow to load and then slow to calculate. Why will this happen? It has to do with the way Excel handles memory. When an Excel file is loaded, the entire file is loaded into memory. Excel does this to allow for quick data processing and access. The drawback to this behavior is that each time something changes in your spreadsheet, Excel has to reload the entire spreadsheet into memory. The net result in a large spreadsheet is that it takes a great deal of memory to process even the smallest change in your spreadsheet. Eventually, each action you take in your gigantic worksheet will become an excruciating wait.
Your pivot tables will require bigger pivot caches, almost doubling your Excel workbook's file size. Eventually, your workbook will be too big to distribute easily. You may even consider breaking down the workbook into smaller workbooks (possibly one for each region). This causes you to duplicate your work. Not to mention the extra time and effort it would take should you want to recombine those workbooks.
In time, you may eventually reach the 1,048,576-row limit of your worksheet. What happens then? Do you start a new worksheet? How do you analyze two datasets on two different worksheets as one entity? Are your formulas still good? Will you have to write new macros?
These are all issues you need to deal with.
Of course, you will have the Excel power-users, who will find various clever ways to work around these limitations. In the end, though, they will always be just workarounds. Eventually, even these power-users will begin to think less about the most effective way to perform and present analysis of their data and more about how to make something “fit” into Excel without breaking their formulas and functions. Excel is flexible enough that a proficient user can make most things fit into Excel just fine. However, when users think only in terms of Excel, they are undoubtedly limiting themselves, albeit in an incredibly functional way.
In addition, these capacity limitations often force Excel users to have the data prepared for them. That is, someone else extracts large chunks of data from a large database and then aggregates and shapes the data for use in Excel. Should the serious analyst always be dependent on someone else for his or her data needs? What if an analyst could be given the tools to access vast quantities of data without being reliant on others to provide data? Could that analyst be more valuable to the organization? Could that analyst focus on the accuracy of the analysis and the quality of the presentation, instead of routing Excel data maintenance?
Access is an excellent (many would say logical) next step for the analyst who faces an ever-increasing data pool. Since an Access table takes very few performance hits with larger datasets and has no predetermined row limitations, an analyst can handle larger datasets without requiring the data to be summarized or prepared to fit into Excel. Since many tasks can be duplicated in both Excel and Access, an analyst proficient at both will be prepared for any situation. The alternative is telling everyone, “Sorry, it is not in Excel.”
Also, if ever a process becomes more crucial to the organization and needs to be tracked in a more enterprise-acceptable environment, it will be easier to upgrade and scale up if that process is already in Access.
NOTE
An Access table is limited to 256 columns but has no row limitation. This is not to say that Access has unlimited data storage capabilities. Every bit of data causes the Access database to grow in file size. An Access database has a file-size limitation of 2 gigabytes.
Transparency of Analytical Processes
One of Excel's most attractive features is its flexibility. Each cell can contain text, a number, a formula, or practically anything else the user defines. Indeed, this is one of the fundamental reasons Excel is such an effective tool for data analysis. Users can use named ranges, formulas, and macros to create an intricate system of interlocking calculations, linked cells, and formatted summaries that work together to create a final analysis.
So what is the problem with that? The problem is that there is no transparency of analytical processes. Thus, it is extremely difficult to determine what is actually going on in a spreadsheet. Anyone who has had to work with a spreadsheet created by someone else knows all too well the frustration that comes with deciphering the various gyrations of calculations and links being used to perform some analysis. Small spreadsheets performing modest analysis are painful to decipher, while large, elaborate, multi-worksheet workbooks are virtually impossible to decode, often leaving you to start from scratch.
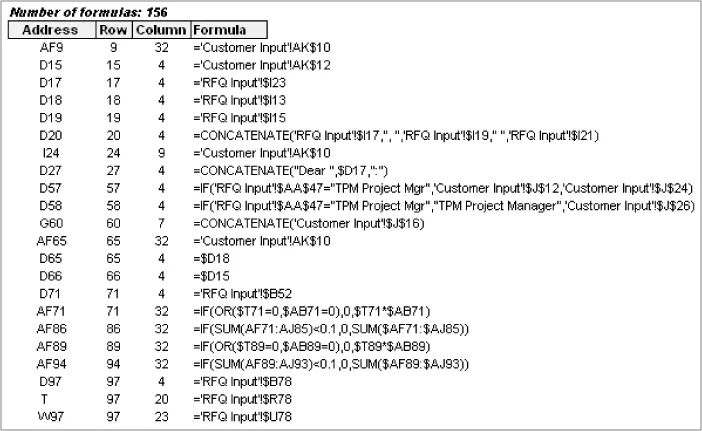
Even auditing tools available with most Excel add-in packages provide little relief. Figure 1.1 shows the results of a formula auditing tool run on an actual workbook used by a real company. It's a list of all the formulas in this workbook. The idea is to use this list to find and make sense of existing formulas. Notice that line one shows that there are 156 formulas. Yeah, this list helps a lot; good luck.
Figure 1.1 Formula auditing tools don't help much in deciphering spreadsheets.
Compared to Excel, Access might seem rigid, strict, and unwavering in its rules. No, you can't put formulas directly into data fields. N...
Table of contents
- Cover
- Title Page
- Copyright
- Dedication
- About the Author
- Credits
- Acknowledgments
- Introduction
- Part I: Fundamentals of Data Analysis in Access
- Part II: Basic Analysis Techniques
- Part III: Advanced Analysis Techniques
- Part IV: Reports, Dashboards, and Visualization in Access
- Part V: Advanced Excel and Access Integration Techniques
- Part VI: Appendixes
- Index
Frequently asked questions
Yes, you can cancel anytime from the Subscription tab in your account settings on the Perlego website. Your subscription will stay active until the end of your current billing period. Learn how to cancel your subscription
No, books cannot be downloaded as external files, such as PDFs, for use outside of Perlego. However, you can download books within the Perlego app for offline reading on mobile or tablet. Learn how to download books offline
Perlego offers two plans: Essential and Complete
- Essential is ideal for learners and professionals who enjoy exploring a wide range of subjects. Access the Essential Library with 800,000+ trusted titles and best-sellers across business, personal growth, and the humanities. Includes unlimited reading time and Standard Read Aloud voice.
- Complete: Perfect for advanced learners and researchers needing full, unrestricted access. Unlock 1.4M+ books across hundreds of subjects, including academic and specialized titles. The Complete Plan also includes advanced features like Premium Read Aloud and Research Assistant.
We are an online textbook subscription service, where you can get access to an entire online library for less than the price of a single book per month. With over 1 million books across 990+ topics, we’ve got you covered! Learn about our mission
Look out for the read-aloud symbol on your next book to see if you can listen to it. The read-aloud tool reads text aloud for you, highlighting the text as it is being read. You can pause it, speed it up and slow it down. Learn more about Read Aloud
Yes! You can use the Perlego app on both iOS and Android devices to read anytime, anywhere — even offline. Perfect for commutes or when you’re on the go.
Please note we cannot support devices running on iOS 13 and Android 7 or earlier. Learn more about using the app
Please note we cannot support devices running on iOS 13 and Android 7 or earlier. Learn more about using the app
Yes, you can access The Excel Analyst's Guide to Access by Michael Alexander in PDF and/or ePUB format, as well as other popular books in Computer Science & Databases. We have over one million books available in our catalogue for you to explore.