- English
- ePUB (mobile friendly)
- Available on iOS & Android
Time Series Data Analysis Using EViews
About this book
Do you want to recognize the most suitable models for analysis of statistical data sets?
This book provides a hands-on practical guide to using the most suitable models for analysis of statistical data sets using EViews - an interactive Windows-based computer software program for sophisticated data analysis, regression, and forecasting - to define and test statistical hypotheses. Rich in examples and with an emphasis on how to develop acceptable statistical models, Time Series Data Analysis Using EViews is a perfect complement to theoretical books presenting statistical or econometric models for time series data. The procedures introduced are easily extendible to cross-section data sets.
The author:
- Provides step-by-step directions on how to apply EViews software to time series data analysis
- Offers guidance on how to develop and evaluate alternative empirical models, permitting the most appropriate to be selected without the need for computational formulae
- Examines a variety of times series models, including continuous growth, discontinuous growth, seemingly causal, regression, ARCH, and GARCH as well as a general form of nonlinear time series and nonparametric models
- Gives over 250 illustrative examples and notes based on the author's own empirical findings, allowing the advantages and limitations of each model to be understood
- Describes the theory behind the models in comprehensive appendices
- Provides supplementary information and data sets
An essential tool for advanced undergraduate and graduate students taking finance or econometrics courses. Statistics, life sciences, and social science students, as well as applied researchers, will also find this book an invaluable resource.
Tools to learn more effectively

Saving Books

Keyword Search

Annotating Text

Listen to it instead
Information
- Annual: specify the year. Years from 1930 to 2029 may be identified using either 2- or 4-digit identifiers (e.g. ‘32’ or ‘1932’). All other years must be identified with full year identifiers.
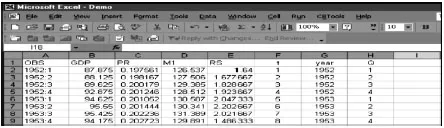
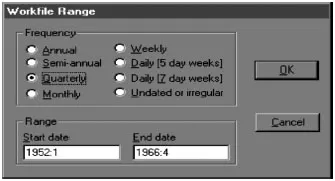
- Quarterly: the year followed by a colon or the letter ‘Q,’ and then the quarter number. Examples: ‘1932: 3,’ ‘32: 3’ and ‘2003Q4.’
- Monthly: the year followed by a colon or the letter ‘M,’ and then the month number. Examples: ‘1932M9’ and ‘1939: 11.’
- Semiannual: the year followed a colon of the letter ‘S,’ and then either ‘1’ or ‘2’ to denote the period. Examples: ‘1932: 2’ and ‘1932S2.’
- Weekly and daily: by default, these dates should be specified as month number, followed by a colon, then followed by the day number, then followed by a colon, followed by the year. For example, entering ‘4: 13: 60’ indicates that the workfile begins on April 13, 1960.
- Alternatively, for quarterly, monthly, weekly and daily data, just the year can be entered and EViews will automatically specify the first and the last observation.
- For...
Table of contents
- Cover
- Series
- Title
- Copyright
- Dedication
- Preface
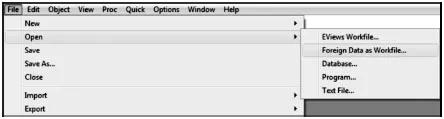
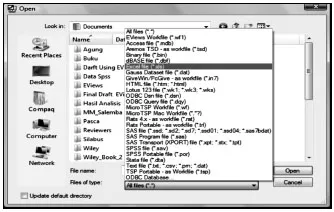
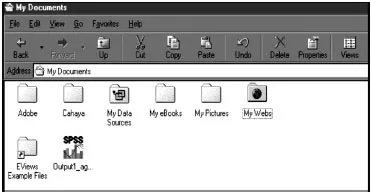
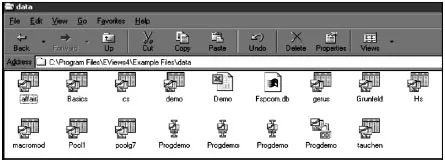
- CHAPTER 1: EViews workfile and descriptive data analysis
- CHAPTER 2: Continuous growth models
- CHAPTER 3: Discontinuous growth models
- CHAPTER 4: Seemingly causal models
- CHAPTER 5: Special cases of regression models
- CHAPTER 6: VAR and system estimation methods
- CHAPTER 7: Instrumental variables models
- CHAPTER 8: ARCH models
- CHAPTER 9: Additional testing hypotheses
- CHAPTER 10: Nonlinear least squares models
- CHAPTER 11: Nonparametric estimation methods
- Appendix A: Models for a single time series
- Appendix B: Simple linear models
- Appendix C: General linear models
- Appendix D: Multivariate general linear models
- References
- Statistics in Practice
- Index
Frequently asked questions
- Essential is ideal for learners and professionals who enjoy exploring a wide range of subjects. Access the Essential Library with 800,000+ trusted titles and best-sellers across business, personal growth, and the humanities. Includes unlimited reading time and Standard Read Aloud voice.
- Complete: Perfect for advanced learners and researchers needing full, unrestricted access. Unlock 1.4M+ books across hundreds of subjects, including academic and specialized titles. The Complete Plan also includes advanced features like Premium Read Aloud and Research Assistant.
Please note we cannot support devices running on iOS 13 and Android 7 or earlier. Learn more about using the app